Support and resistance trading strategies
For professional traders, the analysis of support and resistance levels in the foreign exchange market is a key component of technical analysis. Here are some cases where you can use a support and resistance forex trading strategy on trend lines.
Please note that it is sometimes difficult to connect specific price points as in the below examples. Furthermore, false breaks can sometimes occur, so it is therefore best to define areas of support instead of specific price levels.
The trading range or horizontal tunnel
In forex trading, currency pair prices often consolidate within a horizontal trading range, it is therefore important that one know how to take advantage of these support and resistance areas. In the below chart, the horizontal lines represent zones where a market reversal is highly probable.
The first strategy consists in simply selling at the resistance level and buying at the support level. To avoid losing money due to false breakout signals, which frequently occur on the forex market, you can also wait for a clear break through the trading range in order to initiate a trade on a pullback in the direction of the breakout.

Trading rebounds with regards to horizontal levels
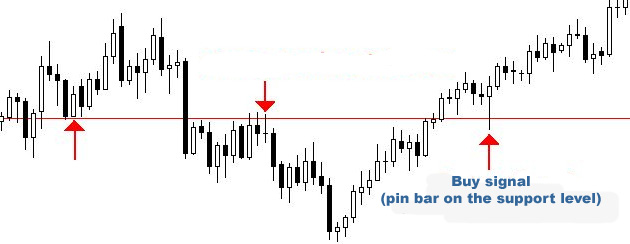
In the currency exchange market, a significant horizontal support or resistance area can provide important information regarding trade entries or exits. The odds that forex prices will reverse increase considerably if the horizontal line proves to be a significant support level or if it was a resistance area previously.
In the sample illustration below, the horizontal level is evident since it has been tested twice before the buying signal. We can also see a hammer-shaped or pin bar candlestick which clearly shows the rejection of this horizontal support zone. Such rebounds on horizontal lines often occurs in areas of overlap zones, where resistance becomes support and vice versa.
Trading trend lines
Rebounds on a trend line can be good entry points in the direction of the trend, especially when they occur at the same time as candlestick figures such as the hammer, the hangman or the pin bar.
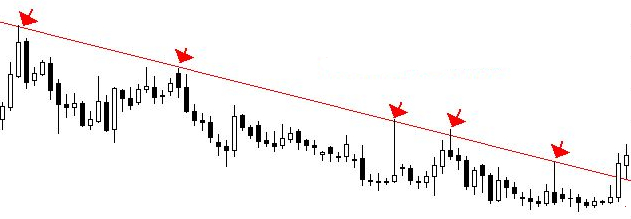
To find entry points on the breaks of these trend lines, the safest and most conservative approach is to wait until the price goes backwards to the previously broken support level (pullback) in order to initiate a trade in the direction of the first break.
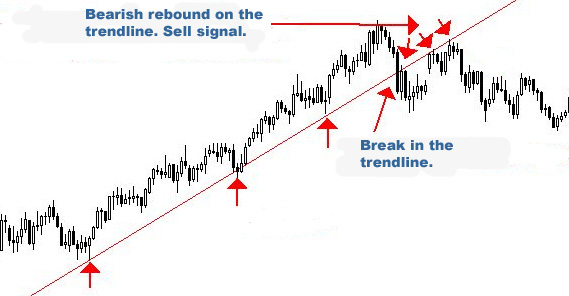
The analysis of trendlines is quite subjective and varies between traders. It should therefore be used in conjunction with other indicators such as support and resistance, Fibonacci retracements or for example a moving average. The convergence of signals increases the probability of a successful trade.
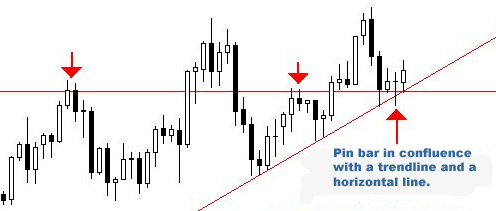
On the below daily chart, we can see a market configuration featuring a pin bar, also referred to as a hammer, forming near a horizontal line level that is in confluence with a trend line. This is a good buy signal.