What is a Renko chart?
A Renko chart consists of bricks (rather than candles) called renga - the Japanese word for brick. Each brick represents a given price movement - in currency trading, this is expressed as a number of pips that you determine when you create the chart. Bricks form when the price moves enough in one direction to cover the number of pips.
The first effect of forming a chart this way is the eliminiation of time delays. This doesn't mean that there aren't always time components in Renko charts - the time axis always follows X but the way the bricks form isn't the same as the way candlesticks form in traditional charts. We are used to a candlestick forming after a certain amount of time has passed, regardless of the price movement during that time, but on Renko charts this approach is reversed.

How do I read a Renko chart?
The rules behind a Renko chart are so different that you need to set aside everything you've learned about reading charts. When you start examining a Renko chart, you will feel like everything is simplified. The fact that the bricks are forming at the number of pips value you set will make everything seem simple.
Your first task is therefore to set the number of pips per brick. Lower pip values will of course allow bricks to form faster as the price moves in a given direction in small increments. The chart will run faster, which can seem overwhelming to anyone used to trading in longer time frames. Smaller pip values on a Renko chart are best for scalping. Traders who are used to longer time frames will want to slow the chart down by selecting larger pip values. Traders who use a daily chart might struggle with Renko and end up deciding that this is not the right tool for them.
To get started with a Renko chart, you can for example set the number of pips per brick at 10 pips, because this will give you a chart that unfolds relatively quickly, which makes it easier to manipulate and test over time than a chart set at 50 pips, for example. A 50-point Renko chart will take too long to develop new bricks (unless you are using it on a highly volatile currency) which will slow down your testing.
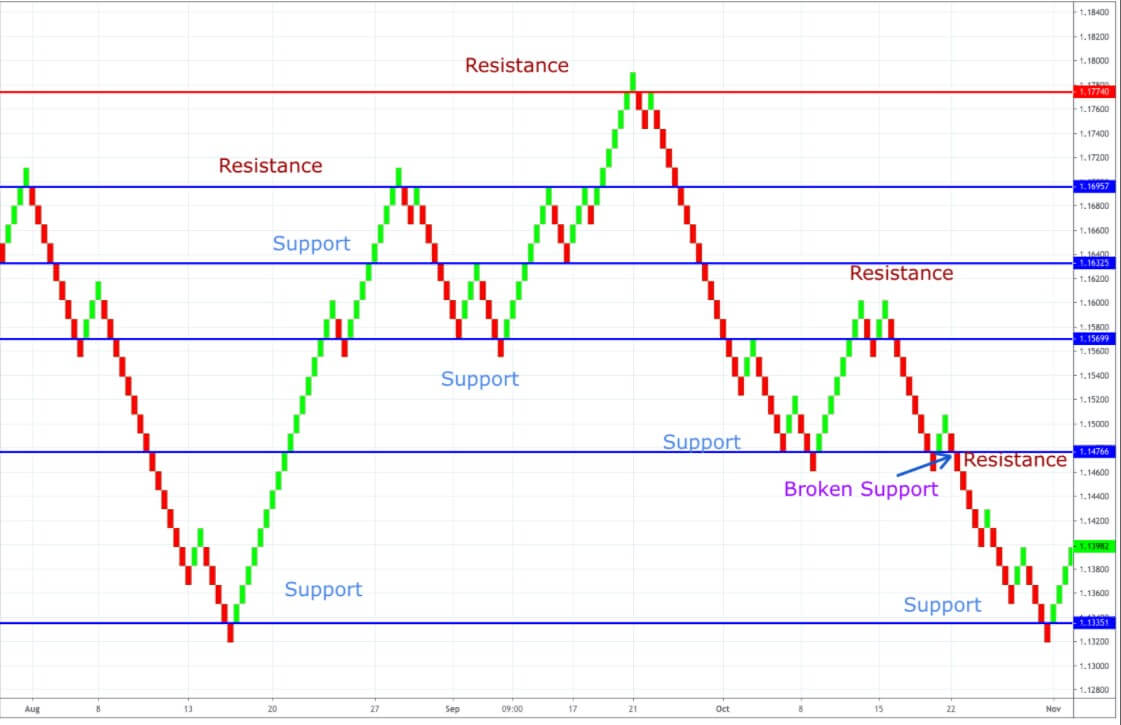
The first thing you'll notice with a Renko chart is that all the bricks are the same length. The second thing you'll notice is that the bricks feature different colors - one represents a rising price and the other represents a falling price. Depending on your platform, you will probably be able to access the settings and change the colours if the default choices don't suit you.
Renko bricks and trend reversals
You will immediately notice that no two bricks lay side by side on the graph. They always form in the corners. This has important implications in terms of how the Renko charts register a change in the direction of prices.
For the trend to appear to change, there must be a significant change in the direction of prices. How does this work? Well, let's say you look at a Renko chart set at 10 pips and the price of a currency drops by 30 pips. This therefore forms three bearish bricks. From there, the price has to drop another nine pips before forming a new brick in that direction. But if the price movement reverses and catches up to those nine points before a new brick forms and goes up an additional 19 points (going back to the beginning of the last brick that formed on your screen), it will still not form a new brick showing the bullish movement. In fact, from our imaginary point of nine points below the last descending brick, the price has to go up 29 points before a new brick forms in the other direction.
This characteristic of Renko charts is really important to understand and keep in mind when designing strategies that rely on the use of Renko bricks. When the price changes direction, it should not only retrace X pips, it must go back in the other direction 2X pips for it to appear on the chart. This will of course have an impact on how you determine your entry and exit points.
The benefits and drawbacks of Renko charts
Renko charts are, after all, just one of the tools at your disposal and while it may sound revolutionary and everyone is talking about it, that doesn't mean it will end up being something you use. It is worth taking this into account when considering some of the benefits they offer and some of the disadvantages that come with their use.
The first benefit is quite important. It will immediately be obvious to you as soon as you open a Renko chart on your platform. It's easy to read! It removes all the noise from a traditional chart and reduces it to its essentials. There are a lot of people - and if you're one of them, there's no shame in that - who are distracted by the noise of traditional charts. Sometimes this can follow you for several years in your trading career. Noise can be a distraction and can cloud your decision-making, especially during critical moments: choosing entry and exit points. Renkos were designed with this fact in mind as a tool deliberately designed to keep noise to a minimum. It does this by filtering out all price movements that are less than the number of pips you selected for the bricks. It allows traders to more clearly identify price trends - one of the holy grails of forex trading.
While being able to identify trends more easily seems to be a major asset for Renkos, you should nevertheless remain on your guard: with great simplicity comes great responsibility. In order to truly profit from the trends that emerge on your Renko chart, you will need to formulate a strict set of entry and exit rules.
By removing noise, Renko charts also erase something that could be very useful: details. This could end up having a few effects that could seriously affect your trading. The first is that it can disguise sudden price movements that are within the pip values ??of a brick. Which can lead to confusing entry signals and cause a whip effect, i.e. the price hits the point where a new brick is formed, but immediately recedes in the other direction.
To protect yourself from these effects, you can make a rule that means that you only enter a trade after a trend has reached a depth of two bricks, i.e. after two bricks or more indicate that the price is going in one direction. The first side effect of this rule is that the profit you can get from this trade will be reduced (because you already had to wait for two or more bricks to form before entering). The second side effect is knowing where to place your exit.
Most people will probably see a trend until the bricks change colour and direction. This isn't necessarily a bad way to go, but - if you remember that it takes a price reversal equal to two bricks of pips before you see a change on your Renko chart - you will realise that this will also reduce your profits. In short, even if everything goes as planned, you lose two valuable bricks when you enter and two valuable bricks when you exit. If the trend is strong enough, it can always translate into a profitable trade, but you also have to remember that things don't always go as planned.
If you open a Renko chart for any currency pair, you are sure to see these beautiful sets of bricks moving up and down on your screen. And, of course, Renko charts identify great trends from time to time. But you'll also see those places on the Renko chart where the bricks zigzag, changing to one colour and then quickly coming back. If you apply the rules we just talked about, waiting for two bricks to form and returning to the exit, these situations are going to drive you nuts.

Lastly, in terms of downsides, there is the fact that Renko charts are only suitable for certain types of trading. They are more suitable for traders looking to catch trends and trade the shorter time frames. Traders who chase trend reversals or prefer to trade on a daily chart are usually left behind. Traders looking for trend reversals will be frustrated by Renko charts, simply because of the way they display price direction changes. Traders on daily charts, on the other hand, will feel like they have to stay chained to their trading platform for fear of missing Renko chart price movements. With Renko charts, they just can't trade by logging in for half an hour each day and reviewing the day's progress because all they will see is how many trades they missed. In short, if you are a daily chart trader and want to use Renko charts, you are probably going to have to completely change the way you trade.
A great opportunity
An empty spot on an old sailing chart can represent both an opportunity and a danger to a seasoned sailor, Renko charts can be both of those things for a trader looking for new territory to explore. While there may be some obvious downsides to the way Renko works with your current trading setup, that doesn't mean it's not a land of opportunity if you're willing to change and develop new ways of doing things.
For example, the current set of indicators that you rely on in your trading system will work completely differently on a Renko chart. In fact, there's a good chance they won't be applicable or work very well (if at all) with a Renko chart. However, there are literally thousands of indicators that could work even better. This is due to the very different way a Renko chart works compared to traditional charts, so the data it provides to an indicator is also very different. This opens up lots of possibilities - there are actually an endless number of combinations that could prove to be incredibly effective if you are willing to try them out.
The only way to truly explore Renko's potential is to devote the time and effort necessary to perform serious testing. Obviously, many traders who have spent years developing and tweaking a system that works for them (and hopefully works objectively) will not be willing to cut and tweak it at this point. On the other hand, there is of course a large number of traders who are always on the lookout for an effective system that works for them. These traders will no doubt appreciate the opportunity to explore uncharted waters.
For those who are willing to put in the necessary time and effort, Renko charts could be a source of adventure and success, provided the exploration is undertaken in a balanced way. Be aware of the downsides, make sure you know the potential pitfalls, keep your calm, but do make sure to take a look at Renko charts and see if they suit your trading style.
Download the Renko indicator for MT4, MT5 or cTrader
