The Pivot Point technique
The Pivot Point technique is a favourite amongst traders for its calculation of Intraday support and resistance levels. The way it works is that it determines a certain number of psychologically important levels that relate to a specific currency pair.
The most important level is the pivot point, if prices evolve above it, it means that we're in an upward trend. The opposite is true for any evolution below this level.
You would therefore take a long position when prices climb past the pivot's level or a short position if the prices fall below the pivot level.
The support (S1 and S2) and resistance (R1 et R2) levels will provide us with objectives to take in our profits.
![]() Also, check out the Pivot Points Forex Trading Strategy
Also, check out the Pivot Points Forex Trading Strategy
Apply pivot points to your forex trading
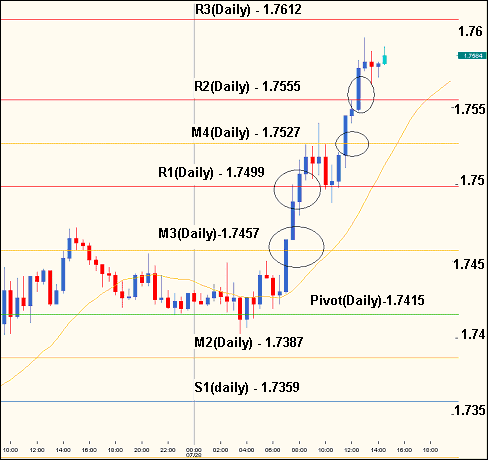
As a rule, pivot points are considered the main support or resistance level. The following illustration is a 30-minute chart of the GBP/USD pair.

This chart shows a day on the foreign exchange market. The GBP/USD price tends to fluctuate between the support and resistance levels identified by the pivot point calculation. The circled areas in the chart clearly illustrate the importance of a break above these levels.
The importance of forex trading hours
There are three main sessions and two overlapping periods on forex (GMT).
Asia: midnight - 9:00
Europe: 07:00 - 17:00
US: 13:00 - 22:00
Overlap Asia / Europe 07:00 - 10:00
Overlap Europe / US 13:00 - 17:00
| Session | 0 | 1 | 2 | 3 | 4 | 5 | 6 | 7 | 8 | 9 | 10 | 11 | 12 | 13 | 14 | 15 | 16 | 17 | 18 | 19 | 20 | 21 | 22 |
|---|---|---|---|---|---|---|---|---|---|---|---|---|---|---|---|---|---|---|---|---|---|---|---|
| Asia | |||||||||||||||||||||||
| Europe | |||||||||||||||||||||||
| US |
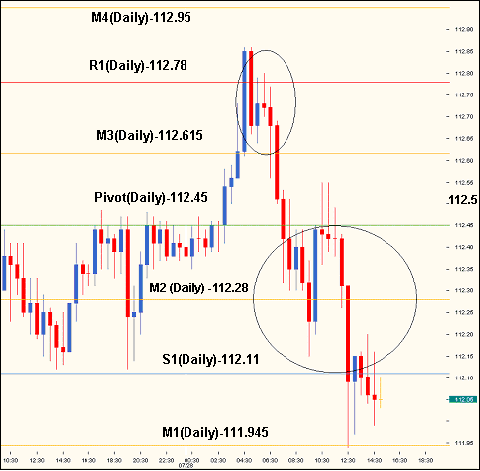
The trading range for a session generally lies between the pivot point and the first support and resistance levels, as a multitude of traders play this trading range. The below USD/JPY chart shows the areas that have remained between the pivot point and the first resistance level, with the pivot acting as support. After the pivot was breached, prices fell, remaining mainly between the pivot and the first support zone.

One of the key points to understand when using pivot points is that breaks tend to occur around one of the market openings, thanks to the immediate influx of traders entering the market at the same time. During the quietest periods, for example between the US close and the Asian open (and sometimes even during the Asian session, which is the quietest session), prices can remain for hours around the pivot point and the support or resistance level.
Two pivot point trading strategies
Many trading strategies can be developed based on pivot points, but the accuracy of support/resistance levels increases when Japanese candlestick formations can be identified. For example, if prices trade below the central pivot for most of the session before breaking above it while creating a reversal chart pattern (such as a shooting star, a doji, or a hanging man), prices will frequently move again below the pivot point.
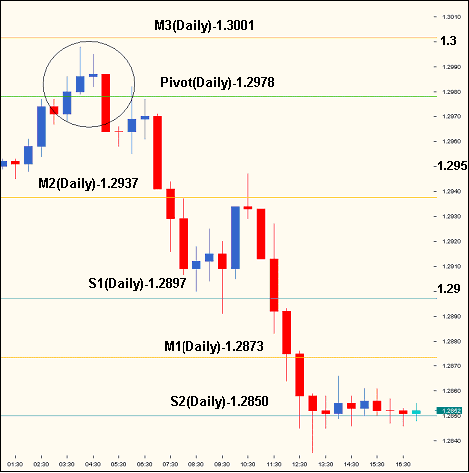
A perfect example of this is shown on the below USD/CHF chart (with 30-minute candles). The USD/CHF stayed between the first support zone and the pivot point for most of the Asian trading session. When Europe joined the market, traders started buying the USD/CHF which rose above the central pivot, but buyers lost control when the second candle became a doji formation.
Prices then dropped below the central pivot to spend the next six hours between the central pivot and the first support zone. Traders looking for this formation could have sold USD/CHF at short notice right after the doji formed to take advantage of at least 80 pips of profit between the pivot point and the first support level.

Another strategy used by traders is to look for prices that bounce off of the pivot, thereby validating the level as an area of strong support or resistance. If the price passes through the pivot point, this indicates that the pivot level is not very strong and is therefore less useful as a trading signal. However, if prices hesitate around this level or "validate" it, this suggests a likely breakout which could result in a continuation move.
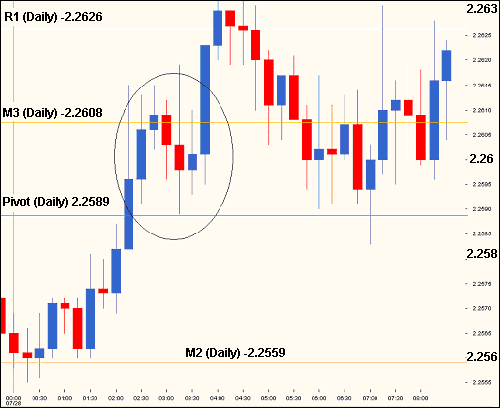
The 15-min GBP/CHF chart below shows an example of prices that “obey” the pivot line. Most of the time, prices are first confined to the mid-level and pivot level. At the European open (2:00 a.m.), GBP/CHF rebounded and rose above the pivot point. Prices then returned to the pivot, held on and continued to rally. The pivot point was tested once again just before the US market opened (7:00 a.m.), this setup gives traders a good buy signal since the pivot level had already been an important support level.

Pivot Point Calculator for Forex Trading
This calculation formula uses yesterday's figures (high, low, closing price).
Automatically insert the pivot points into Meta Trader 4
Unzip and copy the two files in the "expert/indicators" folder:
On the MT4 platform, the file will available in the Programmed Indicators folder.