The "Supertrend" market trend indicator: how it works and strategy
In the world of trading, you've probably heard the expression "follow the trend". This expression is quite common in trading discussions and serves as a reminder, particularly for beginners.
Why is this so important? Well, trading with the trend has several advantages. It increases your chances of success and often offers a better balance risk vs reward ratio.
If you want to follow the trend, the Supertrend indicator is an excellent tool to show you the direction of the trend and help you determine the best price where you should enter and exit your trade.
But that's not all. You can also combine the Supertrader with other indicators such as the MACD, RSI, MA or Stochastics to improve your trading results.
What is the Supertrend indicator?
Supertrend is a trend following indicator that relies on the Average True Range (ATR) for its calculations. It stands out for its ability to take into account market volatility, making its trend assessments more accurate.
Supertrend will help you identify the trend's direction and potential entry or exit points. You can use it for a variety of financial markets, such as currency pairs, stocks and cryptos.
The Supertrend indicator's formula
Here are the Supertrend indicator's formulas:
Top line = (High - Low) / 2 + (multiplier x ATR)
Bottom line = (High - Low) / 2 - (multiplier x ATR)
Where:
- High represents the highest price.
- Low represents the lowest price.
- ATR is the Average True Range.
To calculate the ATR, use this formula:
ATR = ((previous ATR x 13) + current TR) / 14
How do I install the Supertrend indicator on MetaTrader?
The Supertrend indicator isn't included in MetaTrader's platforms, so you need to install it yourself. To do this, you can follow the below steps:
- Download the Supertrend indicator file: MT4, MT5.
- Navigate to the data folder in MetaTrader. You can do this via File -> Open the data folder.
- Inside, locate the MQL4 or MQL5 folder.
- Next, simply copy all folders from the downloaded archive and paste them directly into the MQL4 or MQL5 folder.
- After completing these steps, relaunch MetaTrader.
How do I use the Supertrend indicator in MetaTrader?
To use the Supertrend indicator in MetaTrader 4 and MetaTrader 5, you can use the following guide:
- Choose the chart and timeframe where you want to add the indicator.
- Click on the “Insert” option located at the top of the panel.
- From there, choose "Indicators", and then select "Custom", and then choose "Supertrend".
- A window for the Supertrend indicator appears - click on "OK".
- Your indicator is now ready to use!
Identifying trends and generating trading signals
The Supertrend indicator makes it easier for you to spot trends. Just pay attention to how it moves and how the colour changes.
When the price moves below the indicator line, it turns red, which indicates a downtrend. And when the price moves above the line, the indicator turns green, indicating an upward trend.
Every time the price closes above or below the Supertrend, it signifies the start of a new trend.
The Supertrend indicator works well in markets that are clearly trending up or down. You can easily spot buy and sell signals by watching the indicator move in relation to the closing price.
When the Supertrend indicator closes below price and turns green, it generates a buy signal. And when the supertrend indicator closes above the price and turns red, this represents a sell signal.

Combining Supertrend with other indicators (Multi-Timeframe analysis)
This strategy combines the Supertrend indicator with other indicators within a multi-timeframe analysis.
Start by using the Supertrend indicator on a higher time frame to determine whether the market is in an upward (bullish) or downward (bearish) trend. When the price is above the supertrend line, it is a positive sign that indicates an upward trend.
During an uptrend, it's a good time to consider buying, while during downtrends, you can consider selling.
Next, turn your attention to the MACD and Stochastic indicators on a lower timescale to confirm a buying opportunity. To do this, look for signals such as the MACD crossing its signal line or the Stochastic indicator showing a bullish sign. This confirmation indicates that now is a good time to enter the market.

Trading scenarios with the Supertrend indicator
To help you understand all of this, we'll look at two examples using the Supertrend indicator in trading.
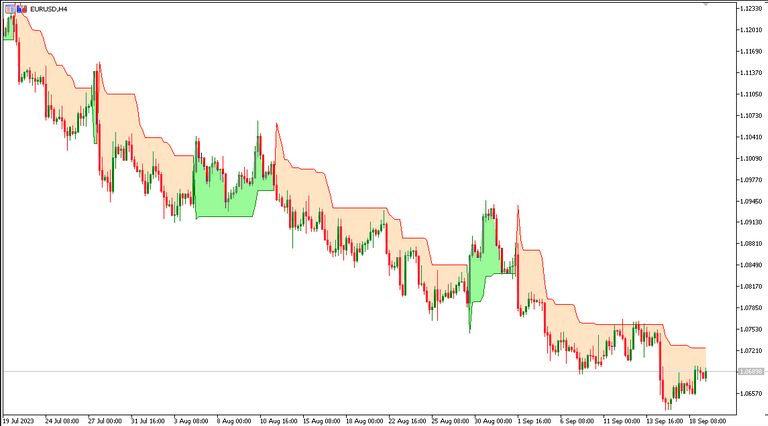
#1 EUR/USD - Buy
In the below EUR/USD H4 chart, we can see that the price is currently in a downward trend. Interestingly, the price is positioned below the Supertrend indicator line. To initiate a buy position, we patiently wait for the red colour to change to green, indicating a change to an uptrend.
When the price continued to rise and broke the support line, the buy position was activated. An entry was made at $1.05063, and a stop loss was set at $1.03929 (113.4 pips).

After the initiation of the buy position, the price continued its upward trajectory. To align with the ascending Supertrend line, the stop loss was adjusted accordingly.
Eventually, the buy position was closed, as the stop loss level was reached at $1.06894. This particular buy position generated a profit of approximately 183.1 pips.

#2 GBP/USD - Sell
In the below GBP/USD H4 chart, we can see a notable change in the price trend. It shifted from an uptrend to a downtrend, which is indicated by the colour change of the Supertrend line from green to red.

Given this clearly bearish trend, it makes sense to open a sell position. Now let's move to the shorter H1 timescale to find potential entry points using the Stochastic indicator.
On the H1 timescale, the sell signal appears when there is a crossover of the stochastic lines above 80. This happened when the price crossed the 80 level, which prompted us to enter a sell position at $1.29522.

We placed a stop loss above the Supertrend line at $1.29772 (25 pips). We constantly adjusted this stop loss downward as the Supertrend line declined. After entering a sell position, the price continued to fall and hit a new low.
Unfortunately, we had to close the sell position at $1.28640 because the stop loss was reached. However, this short position resulted in an 88.2-pip profit.

Benefits and drawbacks of the Supertrend indicator
Benefits
- Easy trend identification: The Supertrend indicator is excellent for indicating the current trend and when it is changing.
- Clear buy and sell signals: When the price crosses the Supertrend line, it sends a signal, which is like a green light for you, allowing you to initiate or exit a trade.
- Fast decision making: The Supertrend uses visual signals that help you make decisions faster. You can see the trend easily and make choices quickly, which is very useful in fast-moving markets.
- Adaptable: The Supertrend indicator is flexible. It can work with different timeframes and asset types, allowing it to accommodate many trading styles and preferences.
- Automatic Protection: Another great feature of the Supertrend indicator is that it can act as a safeguard for your transactions. It can automatically adjust stop-loss levels to lock in profits when a trade is going well. Its like having a safety net for your trades.
Drawbacks
- Challenges of sideways markets: Supertrend works best when the market is going in a clear direction, such as up or down. But when the market is moving sideways or has no clear direction, the Supertrend can struggle. It can give signals that aren't quite correct, which can lead to losses for you.
- Parameter sensitivity: The effectiveness of Supertrend can depend largely on the specific parameters you choose, such as the timeframe and multiplier. Finding the perfect settings can be a little tricky and time-consuming.
- It's not a complete solution: It's very important to know that Supertrend is not a complete trading solution. It can be risky to rely solely on this indicator. Traders often need to use it along with other tools and techniques to make sure they're doing it right.
Backtesting of the Supertrend indicator
To demonstrate the effectiveness of the Supertrend indicator, we performed a backtest. This test phase lasted several months. We divided this period into two 3-month series, one going from February to April 2023, and the other from June to August 2023.
For our assessment, we use the EUR/USD currency pair over the H1 timeframe. To decide when to enter trades, we relied on the supertrend to identify buy and sell signals.
In contrast, for exit positions, we used a risk/reward ratio of 1:2. We allowed price to trigger stop-loss or take-profit levels. Here are the results of our backtesting:
| Details | Value |
|---|---|
| Number of trades | 80 |
| Profit | 35 |
| Loss | 45 |
| Profit rate | 44% |
| Average profit | 2R |
| Average loss | 1R |
| Maximum consecutive losses | 5 |
| Maximum consecutive profits | 4 |
| Avg. number of trades per month | 13 |
| Average profit per month | 4.1% |
| Total 6-month profit | 25R (explained further below) |
A profit rate below 50%?
Out of a total of 80 transactions, we recorded 45 losses and 35 profits, giving us a success rate of 43.75%. In other words, we had more trades that didn't work out as hoped. So, relying solely on the Supertrend indicator to decide when to buy and sell is not always the path to success. If you are uncomfortable with the idea of having more losses than gains, this tool may not be for you.
5 maximum consecutive losses
During our tests, we recorded a maximum of 5 consecutive losses. That's one more than our longest winning streak (4 trades). This means that not only did we have more losing trades overall, but we also had periods where we faced longer losing sequences than winning sequences.
If we were to extend our trading to a larger number of transactions, like 1,000, we could record up to 7 consecutive losses. This tendency towards prolonged loss sequences is often linked to market conditions, when the market is moving sideways or has no clear trend.
Expected profit
Although our success rate was below 50% and we experienced longer losing streaks, our overall strategy remained profitable. This was because we had a wise risk-reward ratio of 1:2. In other words, one successful trade could offset the losses of two bad trades.
Over a six-month period, this approach produced a total profit equal to 25 times the initial risk, often expressed as 25R. This shows that managing our risks wisely can be a successful strategy, even if we don't win more often than we lose.
The average number of trades per month: 13
With an average of 13 trades per month, it's key to understand that this means we won't enter trades every day, especially when using the H1 (1 hour) timeframe. In fact, we only average 3-4 trades a week.
If the idea of not trading every day makes you uncomfortable, you can opt for a shorter time frame, like 15 minutes, which will give you more trading opportunities. But this will come at the cost of lower precision.
If you're looking for a middle ground, you might consider using a multi-time frame analysis approach, as we mentioned above. This will allow you to trade more frequently while benefiting from the insights provided by the higher timeframes.
Recommended brokers for trading with the Supertrend indicator
Supertrend indicator FAQ
How effective is the Supertrend indicator?
The Supertrend indicator can be used on daily, hourly or weekly charts, making it useful for all traders. It works well in trending markets but tends to give false signals in volatile markets. This is why traders use this indicator along with other indicators like MACD, Stochastic, RSI, Parabolic SAR, etc.
How can I avoid the Supertrend indicator's false signals?
To avoid false signals, it's important that you focus on situations where the market is clearly trending upward. When the market is in a strong trend, you don't get many false signals, which means your trading decisions are more likely to be correct. But things change when the trend starts to weaken, especially in times of uncertainty. This is when false signals multiply and your accuracy decreases. This is why it is advisable to always check the strength of the current trend before using the Supertrend indicator.
What are the best settings for the Supertrend indicator?
If you're using Supertrend for the first time, it's best to leave the default ATR settings at 10 and the multiplier at 3. Many traders consider these settings the best because they perform well across various timeframes, such as those used for intraday and multiday trading.
What is the best timeframe for the Supertrend indicator?
There is no “best” timeframe for the Supertrend indicator. It depends on your trading or investing style and your comfort level with the risks and opportunities associated with a given timeframe. However, the lowest time horizon you should use is the 15-minute chart.
Conclusion
The Supertrend indicator is a useful guide for traders in this complicated world of trading. It tells you where the market is going and when to buy or sell. What's interesting is that it takes into account market volatility, which allows it to better predict trends.
But there are things to remember. This tool isn't very useful when the market doesn't know exactly where it's going. Plus, it can be difficult to figure out the best way to use it.
So here's the deal: Supertrend is great, but it's not the only thing you need to be a successful trader. Traders usually use it along with other tools to ensure they make the right decisions. Before putting the Supertrend into action, it's advisable to carry out backtesting to evaluate its performance on a demo account.