Two trading strategies: inside bars and NR4/IB
The inside bar trading strategy
Some of the most popular trading strategies among professional traders are based on the identification of market volatility. There are many ways to interpret changes in volatility, but one of the simplest strategies is purely visual and requires nothing more than a keen eye. Although this trading technique is very popular with professional traders, it actually stands out for its reliability, simplicity and precision. Traders who use this strategy identify intra-day breakouts by looking at their charts in Japanese candlestick mode.

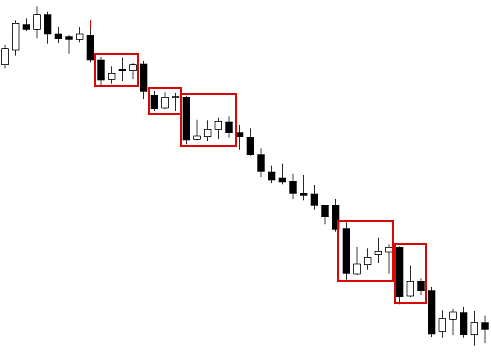
An "inside day" (or inside bar or inner bar) is defined as a trading day in which the daily price range remained within the price range of the previous trading day, or in other words, the maximum and minimum price of the day doesn't exceed the previous trading day's minimum and maximum. For this volatility-based strategy to work, it requires at least two inside days. That is, the price range of bars 2 and 3 does not exceed that of the parent bar. The more bars contained in the price range of the first bar, the higher the likelihood of a sharp increase in volatility that can lead to a breakout scenario.
This technique produces better results in daily charts because the longer the delay, the greater the possibility of a breakout. Some traders apply this strategy on one hour or four hour charts with some degree of success, however, daily charts generate better odds of success when a breakout scenario is identified. In the case of traders looking for inside bars on hourly charts, the chances of a solid breakout increase as the price range contraction precedes the opening of the London or New York markets.
The key factor in this case is to plan for a valid breakout and not get caught in a false break. Traders who use daily charts can anticipate breakouts caused by the news of important economic data that can significantly affect the movement of specific currency pairs or other financial assets.
Generally speaking, this strategy can be applied to all currency pairs, but there are fewer cases of false breaks with currency pairs that have a narrower price range, such as the EUR/GBP, the EUR/CHF, the USD/CAD, the AUD/CAD and the EUR/CAD.
Rules of the trading strategy
Example for a short trade (selling)
- Identify a currency pair in which the daily price range is contained within the price range of the previous trading day for a period of at least two consecutive days (the greater the number of inside days identified, the greater the chances that the strategy will succeed here). To find a currency pair that exhibits these conditions, we recommend that you use daily candlestick charts.
- Open a sell position approximately 10 pips below the parent bar's low (the first bar).
- Place a stop loss and also a reverse order at least 10 pips above the parent bar. These two orders are used to protect the trader from a false breakout. The reverse order is placed for a volume equivalent to twice the initial position.
- The take profit order is placed at a price that is equivalent to twice the amount of risk. When the price reaches this level, the trader can close the entire position or cover only half of it and move the stop loss to protect the profit made by the second half.
If the initial break is a false one and both the stop loss and the reverse order are triggered, the trader should place another stop at least 10 pips below the minimum price of the parent bar. In addition, the trader should protect all of his/her profits above the initial trade amount by using a trailing stop.
Obviously, the reverse can be applied for a long (buy) position.
Optimising the inside bar trading strategy
If you want to further optimise this trading strategy, you can use chart patterns along with visual identification of inside bars to determine the most likely direction of the breakout. For example, if the inner bars are forming towards the top of a recent price range, such as an ascending triangle, then a price break is more likely to occur on the upside.
In addition to chart formations, other technical indicators can be taken into account, including significant support and resistance levels, the presence of major Fibonacci levels or a pin bar formation.

The NR4/IB trading strategy
Another similar strategy based on inner bars is known as the NR4/IB strategy.
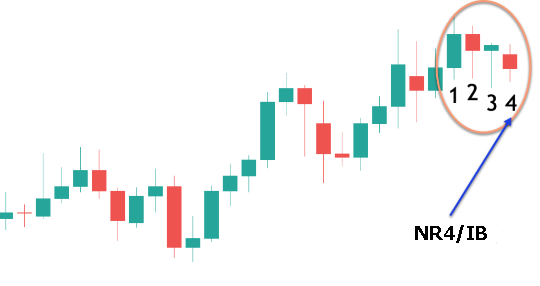
The NR4/IB strategy is essentially an entry technique for intraday trading that was developed by Linda Bradford Raschke and Lawrence Connors. The meaning of the letters NR4/IB is "Narrow Range 4 bars/Inside Bar" and whenever it is detected there is a high probability that a very volatile movement will occur after the formation breaks. In general terms, this pattern consists of the formation of a series of four bars or candlesticks in which it is essential that the following 4 conditions be met:
- The model consists of 4 bars.
- The most recent bar should have a lower high-low price range than the previous three bars.
- The NR4 bar must not exceed the maximum or minimum of the bar preceding it, making it an inside bar.
- A breakout occurs when the price closes above the high or below the low of the NR4 bar.
In order to better understand the NR4 concept, look at the following illustration:
Rules of the trading strategy
According to authors and traders Connors and Raschke, whenever the NR4/IB pattern appears, the best way to approach this formation is as follows:- Traditional approach: a buy order is placed at the bar's high and a sell order at the same bar's low. Thus, one of the orders will be executed when the price has exceeded the inside bar (to the upside or downside).
- Alternative Approach: if you want to use a more conservative approach that allows you to trade more safely with the bullish or bearish breakout of the inner bar, you can place the buy order above the higher of the 4 bars that form the pattern and the sell order below the lowest of those same 4 bars.
In any case, it is recommended that you use the traditional approach as this method is rather reliable and once the bullish or bearish breakout of the inner bar occurs, it is very likely that the breakout movement will be strong enough. to produce a nice profit. This way, you can enter the market almost from the start of the big move.
More details on how it works...
- Recommended trading instruments: This technique can be used in any market, including the forex, gold/silver, stocks, etc. In fact, the NR4/IB model applies to all markets.
- Recommended timelines: Although the NR4/IB model applies to all timelines, it is recommended that the 1-hour (H1) and 4-hour (H4) timelines be used with this system.
- Recommended filters: The system does not require the use of any tools other than price charts, but a moving average can be used as an indicator of the market's overall trend.
Managing your trades
Whether the price is going up or down, one of our orders will be executed and the other one will automatically become a stop loss. Once this happens, the trader must now find the best exit point, either by determining a take profit price, i.e. a fixed number of points from the entry price, or by using a trailing stop that closely follows the price's evolution. A trailing stop can be very useful when the market shows signs that it will continue to move with a strong trend movement.
As soon as one of the orders is executed and a position is opened, you need to manage the trade looking for a set profit level, or use a trailing stop that closely follows the price. Due to the NR4/IB model's potential to precede strong market movements, it is recommended to use a take profit of at least double the stop loss, to have a risk/return ratio no higher than 1:2. This way, the trade will compensate for the risk taken and the odds that the system will be profitable in the long term will be higher.
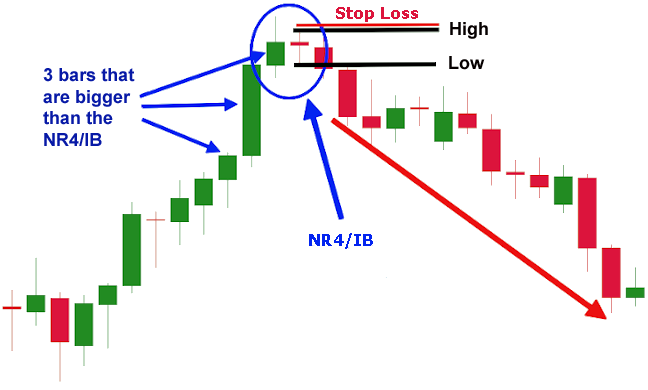
In the following visual example, we can see an NR4/IB bar from which a bearish movement is developing:
So far, everything above might sound very easy, but many of you are probably wondering how to find an NR4/IB bar because you can't just sit around watching the market all day waiting to find one. For those of you who use platforms like Metatrader 4, you can use custom indicators that allow you to automatically detect these type of bars.
