You are not logged in.
Pages: 1
- Index
- » Analyses / Forecasts (by major banks and brokers)
- » EUR/JPY: massive trend inversion on the daily chart
#1 07-05-2020 14:49:40
- johnedward
- Admin & Trader

- From: Paris - France
- Registered: 21-12-2009
- Posts: 3861
- Website
EUR/JPY: massive trend inversion on the daily chart
EUR/JPY: massive trend inversion on the daily chart
Euro pairs are in a bearish race since the German Constitutional Court ruled that some ECB asset purchases are not "legal". As recently as last week, the eurodollar traded above 1.10, and today traded below 1.08. The eurodollar pair had been trading above 1.10 earlier this week. The EURJPY followed the same trend, rising from 117.70 on Friday to 114.94 today. Amidst this rise in volatility, there are signs that it has just completed a major shift, with the potential for a big reversal.
A wedge shape on the daily chart is not for traders who want quick action. Trading such reversals may require patience and good money management. This is due to the fact that the market may continue to experience volatile fluctuations before moving in the desired direction.
After all, trading a reversal requires a contrarian view, and taking the market in reverse is one of the games that some investors may consider. However, trading using a disciplined approach can work well. Here are some things to consider before taking a long position based on the daily decline of the EURJPY.
A EUR/JPY trading approach
First of all, the price must be reversed within the wedges. The bottom edge of the model, also called the 1-3 trend line according to Elliott's wave theory, holds the key - usually the last movement in the wedge formation pierces the trend line.
Then the inversion must continue until the upper edge of the model is broken. Breaking the so-called 2-4 trend line is the key to moving forward.
Therefore, the plan here could be to exchange over the long term when the upper edge of the model is broken (i.e. where the grey square is located). This already implies a movement back to 117, so a reversal on the lower timeframes may be in progress in any case.
Thirdly, as every trade requires a stop-loss and a take profit, if we zoom out, some may see the falling wedge forming just below the dynamic resistance. It looks as if the bears can continue to push each bounce until the pair reaches a new lower low. However, if one wants to reach a trough here and now, the stop-loss must be at the lowest point of the wedge formation.
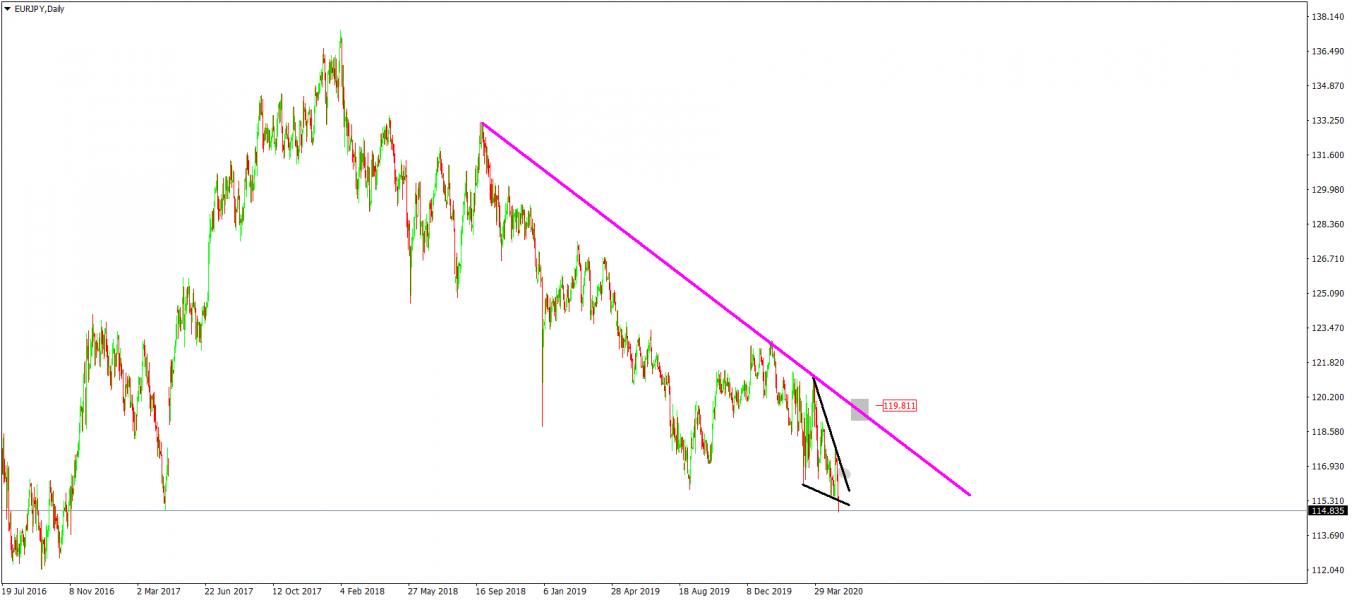
As for the take profit, some may believe that a move to 119 is possible - the price is encountering dynamic resistance against a major downtrend that has been going on for several years.
Opposing trades have the advantage of an earlier entry when the new trend is not yet evident. This is why the volume of these trades generally represents half of the regular volume traded with a trend-following position.
"Anything worth having is worth going for - all the way." - J.R. Ewing
Offline
Pages: 1
- Index
- » Analyses / Forecasts (by major banks and brokers)
- » EUR/JPY: massive trend inversion on the daily chart