You are not logged in.
Pages: 1
- Index
- » Analyses / Forecasts (by major banks and brokers)
- » USD/CAD: a potential bullish flag has formed
#1 13-05-2020 16:14:24
- johnedward
- Admin & Trader

- From: Paris - France
- Registered: 21-12-2009
- Posts: 3861
- Website
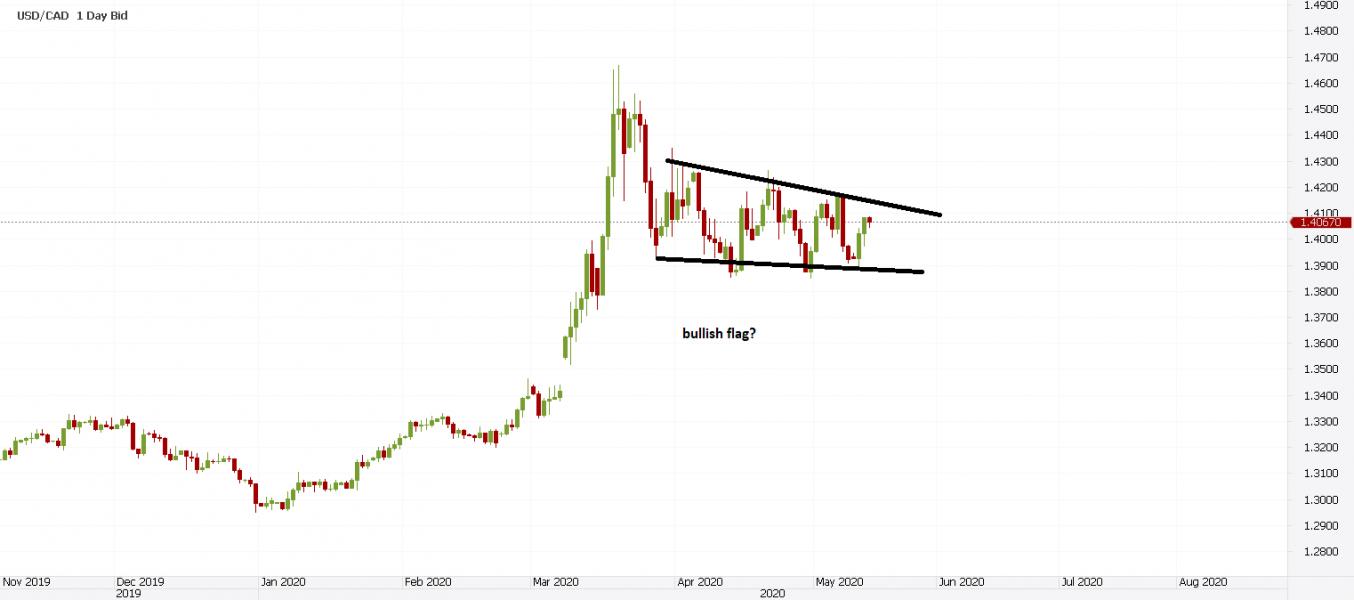
USD/CAD: a potential bullish flag has formed
USD/CAD: a potential bullish flag has formed
One of the most spectacular moves we have seen in the forex this year has occurred in the USDCAD pair. In fact, all CAD pairs are experiencing much volatility, due to the volatility of the crude oil markets.
The USD/CAD is a major pair that reflects the exchange rate between the world's reserve currency, the US dollar, and its northern neighbor, the Canadian dollar. While the greenback serves as a safe haven currency in times of crisis, the CAD is very dependent on what happens with oil prices.
Specifically, higher oil prices cause the CAD to rise, and lower oil prices cause it to fall.
A double combo for USD/CAD bulls
2020 began with news from China that a new virus, undefined at the time, was ravaging its cities and economy. This was not the first time that Asia had experienced a health crisis, so the world treated it with relative indifference.
Before the WHO declared the virus a crisis situation, the oil market collapsed during the price war between Russians and Saudis. The two countries did not agree to reduce production when demand was already slowing down, which brought down the price of oil.
The CAD reacted immediately - it lowered overall, again reflecting its direct correlation with the oil market. As for the USD/CAD exchange rate, it is indirectly correlated: a higher USD/CAD due to lower oil prices.
Moreover, when the severe virus situation took hold, the world already desperately needed the US dollar. Thus, the dual combination explains why the USD/CAD rose from 1.29 to 1.45 in just a few months - a staggering development by any measure.
Such price variations always create ambiguity for technical analysts. If consolidation follows, as seems to be the case now, bulls are looking for continuity trends like a bullish flag. This means that the market breaks the upward consolidation and the bullish trend resumes, sending prices to at least one new higher peak.
However, flag patterns are tricky. First of all, there is no precise estimate of the duration of the consolidation. Then, over such a long period of time, the trend becomes evident and many market participants become aware of the bullish implications. Therefore, as the principle of market efficiency tells us, these anomalies tend to disappear when traders act in the opposite direction.
One thing is certain: the double combo that hit the USD/CAD this year was a movement that was difficult to anticipate at the beginning of the trading year. Whatever the new market direction, it shows how fundamental and technical analysis combine to interpret and predict market movements.
"Anything worth having is worth going for - all the way." - J.R. Ewing
Offline
Pages: 1
- Index
- » Analyses / Forecasts (by major banks and brokers)
- » USD/CAD: a potential bullish flag has formed