You are not logged in.
Pages: 1
- Index
- » Analyses / Forecasts (by major banks and brokers)
- » USD/CAD: December's signal - bulls are in control
#1 30-11-2021 17:53:53
- johnedward
- Admin & Trader

- From: Paris - France
- Registered: 21-12-2009
- Posts: 3861
- Website
USD/CAD: December's signal - bulls are in control
USD/CAD: December's signal - bulls are in control
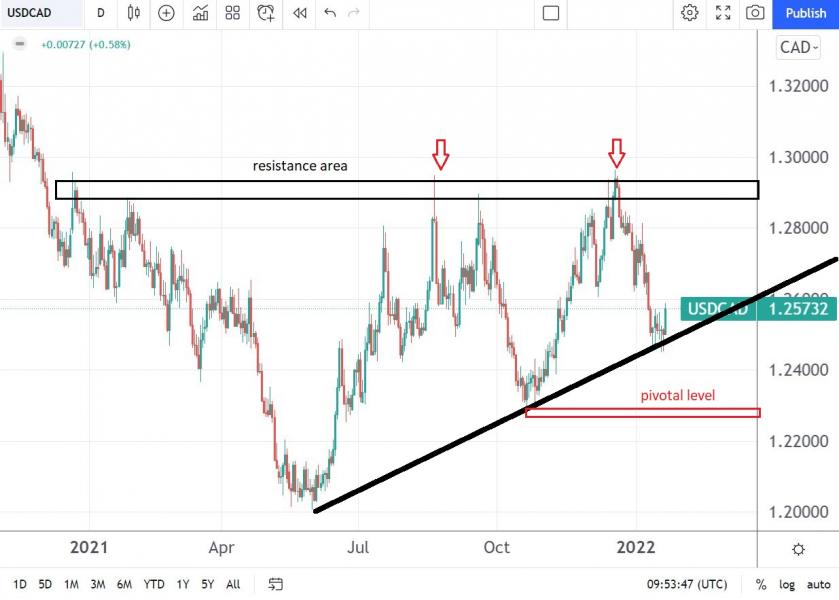
An inverted head and shoulders pattern on the USD/CAD daily chart indicates an upside if the price closes above the neckline. 1.35 is not out of the question, as the measured movement of the pattern shows.
This year has so far been characterised by a continued rally in crude oil prices. The rally followed the rebound from negative territory in 2020 and led to the appreciation of all commodity-related currencies, such as the Canadian dollar, seen below against the US dollar.
But as the price of oil continued its rally past the summer months, the USD/CAD pair failed to break through the 1.20 mark. Furthermore, it formed an inverted head and shoulders pattern that points to higher levels, should the market manage to close above the neckline of the pattern and make a new higher high.
The recent strength in USD/CAD is even more curious if we leave out the influence of oil. Because the Canadian economy is energy intensive, its GDP fluctuates with the price of oil, hence the influence of oil on the Canadian dollar exchange rate.
What is curious here is that the Bank of Canada is well on its way to tightening monetary policy. Yet the Canadian dollar is falling. Perhaps the rally from the April 2020 lows to the summer 2021 highs was so powerful that traders have already factored in the Bank of Canada's upcoming moves.
What about the technical picture?
USD/CAD inverted head and shoulders pattern points to a December rise
A head and shoulders pattern has four elements: two shoulders, a head and a neckline. By measuring the distance between the head and neckline and projecting it from there, we can know the measured movement, also known as the minimum distance the market has to move.
In this case, it is bullish because the pattern has formed at the end of a downtrend. The measured movement is pointing towards 1.35 and higher as the current price struggles to break the neckline.
An important aspect here is that the neckline has already rejected the price action several times before the current test. Any support or resistance level that is still being tested after several rejections will eventually give way, so the bias is bullish. On the other hand, a move below 1.24 would invalidate the inverse head and shoulders pattern.
"Anything worth having is worth going for - all the way." - J.R. Ewing
Offline
Pages: 1
- Index
- » Analyses / Forecasts (by major banks and brokers)
- » USD/CAD: December's signal - bulls are in control