You are not logged in.
Pages: 1
- Index
- » Analyses / Forecasts (by major banks and brokers)
- » Gold/USD: 3 reasons why gold may soon hit its all-time high
#1 22-02-2022 10:36:09
- johnedward
- Admin & Trader

- From: Paris - France
- Registered: 21-12-2009
- Posts: 3861
- Website
Gold/USD: 3 reasons why gold may soon hit its all-time high
Gold/USD: 3 reasons why gold may soon hit its all-time high
The price of gold is surging due to rising inflation. The technical picture shows a bullish breakout with a new attempt to reach historical highs in the charts.
The price of gold intrigued investors during the virus situation. As inflation rose to levels not seen in decades, gold, the traditional hedge against inflation, failed to protect portfolios from rising prices of goods and services.
Moreover, it generated negative returns last year. However, the decline turned out to be a contracting triangle that recently broke higher. Its measured movement points to a new all-time high and inflation continues to rise.
Inflation continues to soar
Last month, inflation reached 7.4% in the US, a 40-year high. But the US is not the only country in the developed world where inflation has risen.
For example, the producer price index or PPI data was released today in Germany. It turns out that inflationary pressures have also accelerated in Germany, with PP jumping by more than 24% year-on-year. Most of the increase is due to energy prices, but even without this, inflation is still up 11.5% year-on-year.
As inflation on the producer side is passed on to consumers, a rise in the CPI is expected in the coming months.
The contracting triangle has dropped to a high
Rising inflation may offer a strong incentive to buy gold, but so does the technical picture. As mentioned earlier, after reaching a new all-time high during the pandemic, the gold price consolidated in what appears to be a bullish contraction triangle.
More recently, the price has broken above the BD trend line. Moreover, it has retested it, offering a good opportunity to buy the yellow metal on dynamic support.
When the price breaks the bd trend line, the triangle ends and the price is not expected to return above the e-wave level. Therefore, the bulls have a case for a new all-time high while the price remains above $1,800.
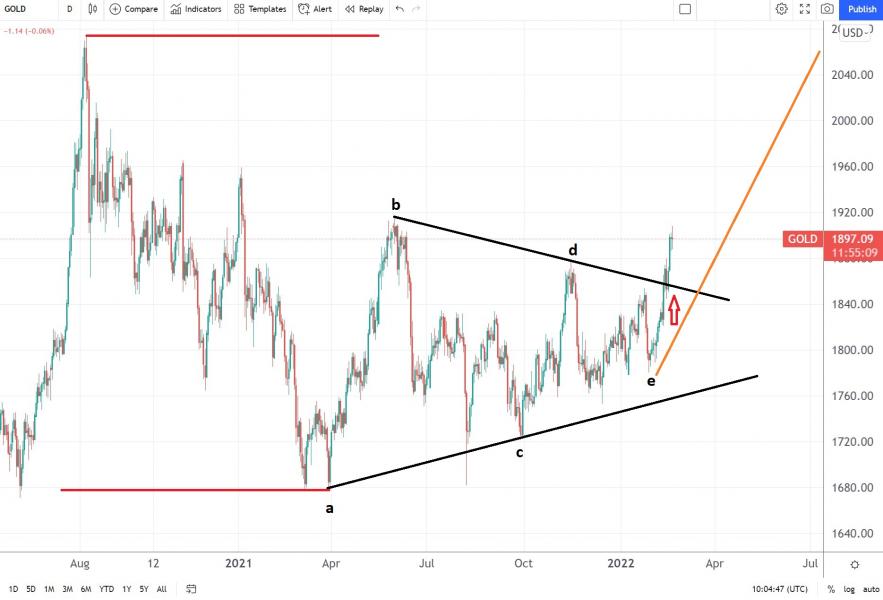
Measured movement points to a new all-time high
The measured movement of a contracting triangle is 75% of its longest segment, projected from the end of the triangle consolidation. It represents the minimum distance the price should travel and indicates a new attempt to reach the all-time high made in the summer of 2020.
"Anything worth having is worth going for - all the way." - J.R. Ewing
Offline
Pages: 1
- Index
- » Analyses / Forecasts (by major banks and brokers)
- » Gold/USD: 3 reasons why gold may soon hit its all-time high