You are not logged in.
#1 12-02-2026 17:03:26
- johnedward
- Admin & Trader

- From: Paris - France
- Registered: 21-12-2009
- Posts: 3889
- Website
What is a Golden Cross on the stock market?
What is a Golden Cross on the stock market?
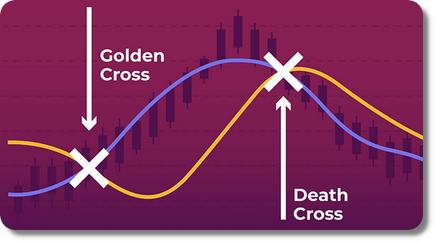
The Golden Cross is one of the most closely watched technical analysis indicators because it signals a shift in market sentiment from bearish to bullish. It also tends to attract increased participation from traders, as many see it as an early sign of improving momentum. While it is not generally a sign of a long-term trend, it tends to appear when optimism begins to develop, volatility increases, and new trading opportunities emerge.
A Golden Cross in the stock market is a technical indication of a potential bullish reversal in the market trend. It occurs when the short-term moving average, for example, 50, crosses above the long-term moving average, for example, 200.

Is the Golden Cross a lagging indicator?
Yes, the Golden Cross is a lagging indicator in technical analysis because it uses a moving average that relies on historical price data to generate signals. It indicates that market momentum has already begun to shift upwards. By the time the crossover occurs, the price may have already risen significantly.
The lagging nature of the Golden Cross is more useful for confirming trends than predicting them, as it helps traders identify ongoing momentum rather than anticipating reversals at an early stage.
How does the Golden Cross work in technical analysis?
The Golden Cross in technical analysis typically operates on the crossover of two moving averages: a short-term moving average and a long-term moving average.![]() Short-term moving average: The short-term moving average, usually 50, represents the recent price trend, reacting quickly to recent price movements and capturing short-term market sentiment.
Short-term moving average: The short-term moving average, usually 50, represents the recent price trend, reacting quickly to recent price movements and capturing short-term market sentiment.![]() Long-term moving average: The long-term moving average, usually 200, represents the overall recent market trend by smoothing out short-term volatility and market fluctuations.
Long-term moving average: The long-term moving average, usually 200, represents the overall recent market trend by smoothing out short-term volatility and market fluctuations.![]() The crossover: When the short-term moving average crosses above the long-term moving average, this crossover indicates that recent price action in the market is strong enough to influence the long-term trend, prompting more traders and investors to buy and drive prices higher.
The crossover: When the short-term moving average crosses above the long-term moving average, this crossover indicates that recent price action in the market is strong enough to influence the long-term trend, prompting more traders and investors to buy and drive prices higher.
Together, these three stages illustrate how a weakening downtrend transforms into a sustained uptrend, making the golden cross a powerful confirmation signal of a trend reversal in technical analysis.
What are the stages of a golden cross?
There are three stages: the weakening downtrend, the crossover phase, and the continuation of the uptrend.
Weakening downtrend: This is the initial phase, when the current downtrend begins to weaken. Selling pressure decreases, and momentum stabilizes as sellers control their losses. Value-oriented buyers may begin to quietly accumulate shares, which helps stabilize prices.
Crossover Phase: This is the crucial moment when the short-term moving average (usually 50 days) crosses the long-term moving average (usually 200 days). This crossover confirms the trend reversal and shifts market psychology toward a bullish rather than a bearish trend.
Bullbound Continuation: The new bullish trend takes hold, and buying momentum intensifies after the crossover. Both moving averages tend to slope upward and typically find support at these levels. This stage encourages the involvement of long-term investors, which solidifies the market's bullish trend.
Together, these three stages demonstrate how a weakening downtrend transforms into a sustained bullish one, making the Golden Cross a powerful confirmation signal of a trend reversal.
Most Commonly Used Moving Averages in a Golden Cross
The most commonly used moving averages in a Golden Cross are the 50-period and 200-period moving averages, due to their ideal balance of speed, stability, reliability, market psychology, and institutional acceptance.
However, traders with different styles often prefer other moving average combinations that match their speed, risk appetite, and trading horizon.![]() 20 & 50:Swing traders
20 & 50:Swing traders
Faster confirmation while avoiding excessive noise.![]() 9 & 21: Day traders, momentum scalpers
9 & 21: Day traders, momentum scalpers
Provides fast signals with tight stop-loss zones.
"Anything worth having is worth going for - all the way." - J.R. Ewing
Offline