Intraday trading indicators: the 14 best day trading tools
Intraday trading indicators are technical analysis tools primarily used to analyse market behaviour over shorter timeframes in order to make buying and selling decisions. These indicators help you analyse price, volume, volatility and momentum data to understand market strength, overbought or oversold conditions, and potential trend reversals.
Each indicator has a specific purpose: RSI and MACD are used for momentum, while moving averages and VWAP are used to identify trends. However, no indicator is perfect; this is why traders use them in combination. By combining indicators from different categories, you can increase your chances of success. In this article, we will examine the indicators most commonly used in intraday trading.
Comparison of the best intraday trading indicators
The table below provides a quick comparison of the main intraday trading indicators.
| Indicator | What these indicators measure | Signal type | Optimal intraday use |
|---|---|---|---|
| Relative Strength Index (RSI) | Momentum oscillator (0 to 100 scale) | Overbought (>70), Oversold (<30) | Quick entry/exit points |
| Moving Average Convergence Divergence (MACD) | Trend momentum | Bullish/bearish crossovers, divergence | Identifying trend changes |
| Stochastic Oscillator | Compares the closing price with the price range | Overbought (>80), Oversold (<20) | Spotting intraday reversals |
| Exponential Moving Average (EMA) | Weighted moving average | Trend confirmation and dynamic support/resistance | Determining short-term trend direction (e.g. EMA 9/21) |
| Average Directional Index (ADX) | Trend strength (0 to 100 scale) | Above 25 = strong trend, below 20 = weak trend | Confirming the validity of a trend |
| On-Balance Volume (OBV) | Cumulative volume | Trend confirmation through volume | Assessing the underlying strength of a trend |
| Volume Weighted Average Price (VWAP) | Volume-weighted average price | Price above the VWAP = bullish, below = bearish | Institutional benchmark for day trading |
| Bollinger Bands | Volatility bands (± 2 standard deviations) | Overbought/oversold, breakout signals | Identifying volatility squeezes and breakouts |
| Market Profile | Volume distribution by price level | Value Area, Point of Control (POC) | Identifying key intraday support and resistance levels |
| Money Flow Index (MFI) | Price + volume oscillator (0 to 100) | Overbought (>80), Oversold (<20) | Volume-confirmed reversals |
| Choppiness Index | Degree of market consolidation | High = ranging, low = trending | Avoiding trades during highly volatile conditions |
| Darvas Box Theory | Price channels/boxes | Breakout above the box = buy, below = sell | Intraday breakout strategy |
| Ichimoku Cloud | Multi-component trend and momentum | Bullish/bearish cloud zones | Identifying intraday trends and support/resistance |
| Average True Range (ATR) | Market volatility | High ATR = high volatility | Setting stop-loss levels |
1. Relative Strength Index (RSI)
The RSI is a momentum indicator that measures the speed and magnitude of price movements on a scale from 0 to 100. This indicator helps traders identify overbought/oversold zones, reversal points and confirm trend strength.
On a scale from 0 to 100, the most critical RSI levels are 70 and 30.
- RSI above 70: this indicates strong buying momentum or a potential downside price reversal.
- RSI below 30: this indicates strong selling momentum or a potential upside price reversal.
- RSI around 50: the market is then considered neutral or ranging.
The RSI indicator is versatile and can be used differently depending on market conditions, such as a trending market, a sideways market or during a momentum breakout. There are four ways to use the RSI in intraday trading, briefly presented below.

- Oversold rebound entry: When the RSI falls below 30 following an excessive price decline, prices tend to rebound. This is when traders consider a long position to benefit from the bullish reversal. However, it is important to note that an RSI below 30 is not automatically a buy signal. The RSI can remain below this level for an extended period if the market is strongly bearish. Therefore, it is advisable to wait for confirmation of a bullish price pattern before entering a position.
- Overbought reversal entry: When the RSI exceeds 70 following an excessive price increase, prices tend to reverse. This is when traders consider short positions to benefit from the bearish reversal after a strong rally. Trading an overbought reversal also requires waiting for confirmation of a bearish price pattern before entering a position, as the RSI can remain above 70 for an extended period in a strongly bullish market.
- RSI divergence: RSI divergence is another way to identify trend reversals. When price and the indicator move in opposite directions, it suggests a loss of momentum and a potential trend reversal. For example, when price reaches a new high but the RSI forms a lower high, this signals weakening bullish momentum and a potential downside reversal.
- Trend trading: In a strong uptrend, the RSI remains above 50, with the 40-50 zone acting as a buying zone for trend traders. Conversely, in a strong downtrend, the RSI remains below 50, with the 50-60 zone acting as a selling zone.
The default RSI setting is generally 14 periods, but intraday traders often use shorter settings such as 7, 9 or 11 for faster signals. A backtest of the mean reversion strategy conducted by Larry Connors found a success rate between 65% and 80%.
| RSI summary table | |
|---|---|
| Category | Momentum oscillator |
| Type | Leading indicator |
| Optimal use | Identification of momentum, reversals and trend strength |
| Market conditions | Ranging and moderately trending markets |
2. Moving Average Convergence Divergence (MACD)
The MACD (Moving Average Convergence Divergence) is a trend-following momentum indicator that combines trend detection and momentum measurement in a single tool. Traders frequently use it to detect and confirm trends, as well as to identify momentum breakouts and trend reversals.
The MACD indicator consists of three elements: the MACD line, the signal line and the histogram. The interaction of these elements generates actionable trading signals, briefly presented below.
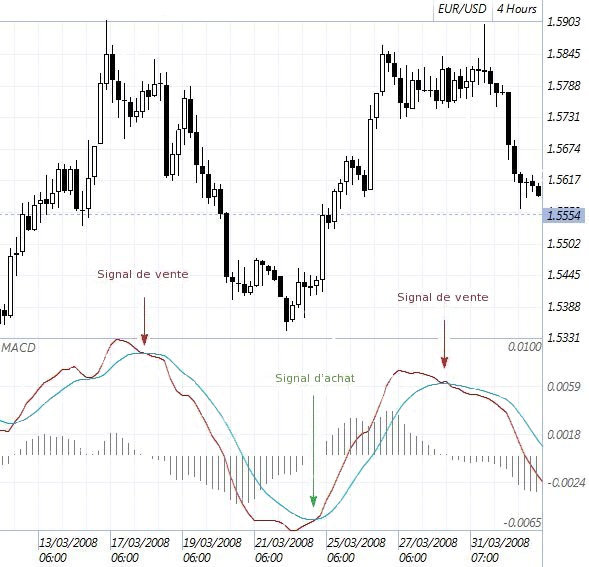
- Bullish crossover: When the MACD line crosses above the signal line, it indicates a bullish momentum shift, prompting traders to take a long position. This signal is strengthened when it appears below the zero line.
- Bearish crossover: When the MACD line crosses below the signal line, it indicates a bearish momentum shift, prompting traders to take a short position. This signal is strengthened when it appears below the zero line.
- MACD divergence: This indicator helps traders identify and exploit trend reversals. When price and the indicator move in opposite directions, it suggests weakening momentum and a possible trend reversal.
- Histogram: The MACD histogram helps to understand momentum acceleration. A wide histogram bar indicates strong momentum, while a short or V-shaped bar indicates weakening.
A study conducted on arXiv using stock indices showed that MACD crossover-based systems achieved success rates of around 45% to 56%, but larger average gains still made them profitable despite lower accuracy. The real strength of MACD lies in the slope of its histogram and its amplitude.
| MACD summary table | |
|---|---|
| Category | Trend-following momentum indicator |
| Type | Lagging indicator |
| Optimal use | Directional signals, momentum and trend crossovers |
| Market conditions | Trending markets |
3. Stochastic oscillator
The stochastic oscillator is a momentum indicator that measures the gap between an asset’s closing price and its price range over a given period, typically 14 days. Its value oscillates between 0 and 100, signalling overbought and oversold conditions. It also helps identify momentum shifts, trend reversals and short-term entry/exit points.
The stochastic oscillator consists of two elements: the %K line (the main momentum line), and the %D line (a 3-period moving average of the %K line). Crossovers between these two lines generate buy and sell signals.

- Buy signal: When the %K line crosses above the %D line and the stochastic is below 20, a buy signal is generated.
- Sell signal: When the %K line crosses below the %D line and the stochastic is above 80, a sell signal is generated.
- Overbought/oversold condition: A stochastic above 80 indicates overbought conditions, while below 20 indicates oversold conditions. This situation suggests a potential market reversal.
- Divergence: When the indicator and price move in opposite directions, it signals weakening momentum and a potential trend reversal.
The stochastic performs particularly well in ranging markets, with a success rate of up to 55% to 70%. However, its performance decreases in trending markets.
| Stochastic oscillator summary table | |
|---|---|
| Category | Momentum oscillator |
| Type | Leading indicator |
| Optimal use | Identification of overbought/oversold conditions and reversals |
| Market conditions | Ranging and sideways markets |
4. Exponential Moving Average (EMA)
The exponential moving average (EMA) is a trend indicator that measures the average price of an asset over a given period and plots the average price line on the chart. In its calculation, the EMA gives greater weight to recent price changes, which increases its responsiveness.
The EMA is also a versatile indicator that can be used in different ways. There are three ways to use the EMA in day trading, briefly described below.
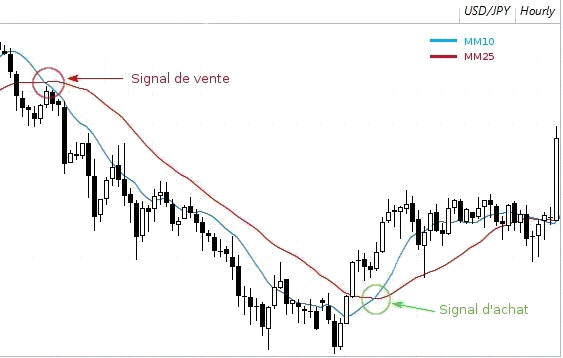
- Trend identification: When price trades above the moving average, it is considered an uptrend and traders favour long positions. Conversely, when price trades below the moving average, it is considered a downtrend and traders favour short positions.
- EMA crossover: EMA crossover uses a combination of two EMAs with different periods to generate buy and sell signals. When a short-term moving average crosses above a long-term moving average, a buy signal is generated. When a short-term moving average crosses below a long-term moving average, a sell signal is generated.
- Support and resistance: EMAs act as dynamic support and resistance, particularly in trending markets, where pullback traders use them as entry points. The EMA acts as support in an uptrend and resistance in a downtrend.
EMAs are mainly used for trend identification and momentum changes rather than for generating buy and sell signals. Therefore, EMA crossover systems generally show modest success rates of around 35% to 55% as buy and sell signals.
| EMA summary table | |
|---|---|
| Category | Trend indicator |
| Type | Lagging indicator |
| Optimal use | Trend direction, dynamic support/resistance and pullback trading |
| Market conditions | Trending markets |
5. Average Directional Index (ADX)
The Average Directional Index (ADX) is used to measure the strength of a market trend, regardless of its direction. Traders use the ADX to avoid consolidation phases, identify strong trends and confirm breakout strength. The ADX ranges from 0 to 100; a value above 20 indicates increasing trend strength. The ADX typically rises above 20 when buyers or sellers gain control of the market.
Although the ADX only indicates trend strength and not direction, direction can be determined using directional movement indicators (DMI), which are associated with the ADX. By combining DMI and ADX, the indicator can be used in four different ways in intraday trading.

- Crossover of +DMI and -DMI lines: Traders use the crossover of +DMI and -DMI lines as a buy/sell signal. When the +DMI line crosses above the -DMI line, it generates a buy signal. Conversely, when the -DMI line crosses above the +DMI line, it generates a sell signal. It is important to note that the ADX must be above 20 when these signals appear to avoid false signals in a sideways market.
- ADX breakout confirmation: When the ADX rises above 20 after a key support or resistance breakout, the probability of continuation in the breakout direction increases.
- ADX trend exhaustion: when the ADX starts to decline after reaching very high levels, it indicates a slowdown in momentum, after which price may consolidate or reverse.
The most important behaviour of the ADX is not its high level itself, but its rise from low levels. This transition often signals an increase in volatility before major directional moves begin.
| ADX summary table | |
|---|---|
| Category | Trend strength indicator |
| Type | Lagging indicator |
| Optimal use | Measurement of trend strength and identification of strong trends |
| Market conditions | Strong trending markets |
6. On-Balance Volume (OBV)
On-Balance Volume (OBV) is a volume-based indicator that measures and plots a cumulative volume curve by adding the volume on up days and subtracting it on down days, in order to analyse buying and selling pressure. This indicator helps traders understand the accumulation and distribution of invested capital, identify trend strength, and confirm breakouts.
Traders use the OBV indicator in four different ways, briefly described below.
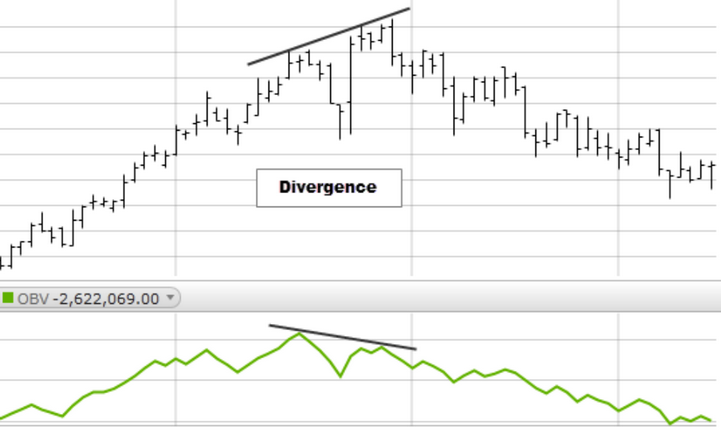
- Trend confirmation: When the price rises, supported by a rising OBV, this confirms the uptrend. Conversely, when the price falls alongside the OBV, this confirms the downtrend.
- OBV divergence: When OBV and price move in opposite directions, this suggests a weakening of momentum. For example, if the price reaches a new high whilst the OBV reaches a lower high, this indicates a bearish divergence (the price will fall following the exhaustion of an uptrend).
- Breakout confirmation: When OBV rises sharply following a breakout, this confirms that the breakout is driven by strong participation. If the OBV remains flat after a breakout, the breakout may be a false signal.
- Accumulation and distribution: OBV is particularly useful for identifying underlying accumulation and distribution phases. If OBV rises whilst the price remains flat, this suggests potential accumulation by informed investors. If OBV falls whilst the price remains stable, this suggests possible distribution of institutional capital.
OBV frequently breaks through resistance before the price does. This is because institutional accumulation often manifests in volume before a visible price breakout occurs. Traders therefore use OBV as a confirmation and divergence indicator rather than for direct entries.
| OBV Summary Table | |
|---|---|
| Category | Volume indicator |
| Type | Leading indicator |
| Optimal use | Confirming trend strength and detecting volume divergences |
| Market conditions | Trending and breakout markets |
7. Volume Weighted Average Price (VWAP)
The Volume Weighted Average Price (VWAP) is a volume-based indicator that measures the average price of a share weighted by trading volume. The VWAP is an intraday indicator commonly used by institutions and algorithms to identify the right entry price. It helps traders identify trend direction and dynamic support and resistance levels.
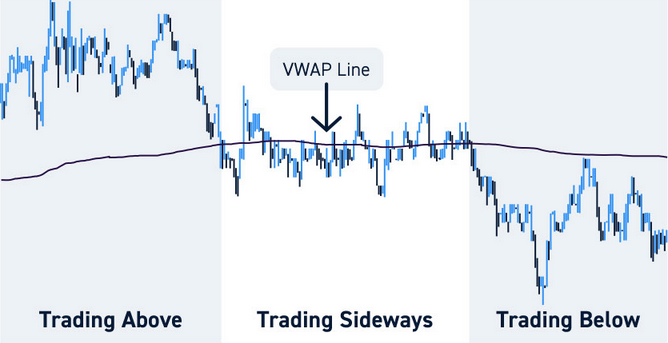
Traders use the VWAP in three different ways in intraday trading, briefly described below.
- For trend identification: The VWAP acts as an intraday trend filter. A price holding above the VWAP suggests an uptrend, whilst a price holding below it suggests a downtrend.
- For pullback trading: During an uptrend, traders will typically look to buy when the price pulls back towards the VWAP and forms a significant bullish candle or pattern. Conversely, during a downtrend, they will look to sell when the price returns to the VWAP and forms a significant bearish candle or pattern.
- VWAP mean reversion: This strategy is based on the mathematical concept of mean reversion, whereby the market returns to its VWAP after having moved significantly away from it. Following a strong expansion away from the VWAP, the price often retraces towards the average traded price.
The mean reversion strategy fails in trending markets, as the price continually moves away from the VWAP. Intraday mean reversion systems around the VWAP have shown a success rate of 55% to 70% in liquid markets, as prices naturally gravitate towards fair value execution zones.
| VWAP Summary Table | |
|---|---|
| Category | Price and volume indicator |
| Type | Lagging indicator |
| Optimal use | Intraday trend identification and dynamic support/resistance |
| Market conditions | Intraday trending markets |
8. Bollinger Bands
Bollinger Bands are a volatility indicator that measures market volatility using +2 and -2 standard deviations from the 20-period moving average. They consist of three bands: the upper band (+2 SD), the middle band (20-period simple moving average), and the lower band (-2 SD). The middle band (20-period simple moving average) serves as the basis for the standard deviation calculation and also acts as dynamic support and resistance.
Traders use Bollinger Bands to analyse market volatility, identify overbought and oversold conditions, and spot breakout points.
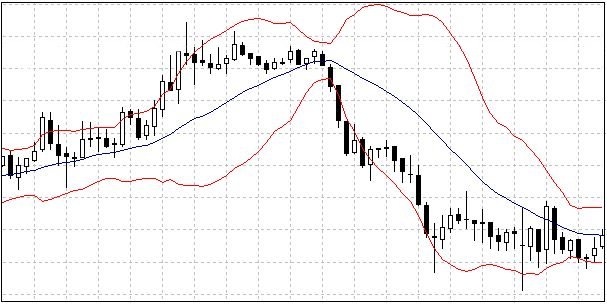
- Bollinger Band bounce strategy: This setup is based on the concept of mean reversion. In a ranging market, when the price reaches one of the bands (upper or lower), it often reverts towards the middle band. However, in a trending market, prices can continue to move along the upper and lower Bollinger Bands for an extended period without reversing. It is therefore important to only enter a reversal position after confirmation.
- Bollinger Band squeeze strategy: Bollinger Bands contract and expand in line with market volatility. When the bands tighten, it means volatility has decreased. Traders watch this type of squeeze closely, as significant moves often occur following a period of low volatility. A breakout above a Bollinger Band may fail, so it is important to confirm it with an increase in volume and momentum.
- Walking the band: In a strongly trending market, the price continues to move near the upper or lower Bollinger Band without reversing. Traders use this dynamic to identify short-term trends.
The true strength of Bollinger Bands lies in volatility contraction. A Bollinger squeeze often signals an imminent expansion in volatility before explosive moves occur.
| Bollinger Bands Summary Table | |
|---|---|
| Category | Volatility indicator |
| Type | Lagging indicator |
| Optimal use | Volatility measurement, breakouts, and mean reversion |
| Market conditions | Volatile markets and ranging markets |
9. Market Profile
Market Profile is an analytical tool that identifies key price levels on a chart - where the market has spent the most time and where the majority of trading volume has been recorded during a given session. This indicator is based on auction market theory, which holds that the market is constantly seeking a fair price between buyers and sellers. It helps traders identify fair value, support and resistance zones, and potential breakout areas.
Market Profile organises price activity into a structure that allows traders to understand where the market has accepted or rejected a price.
- Point of Control (POC): The price level at which trading activity was highest.
- Value Area High (VAH): The upper boundary of the fair value zone.
- Value Area Low (VAL): The lower boundary of the fair value zone.
- Initial Balance (IB): The price range formed at the start of the session.
- Single prints: Areas where the price moved rapidly with very little trading activity, often indicating a significant imbalance between buying and selling.
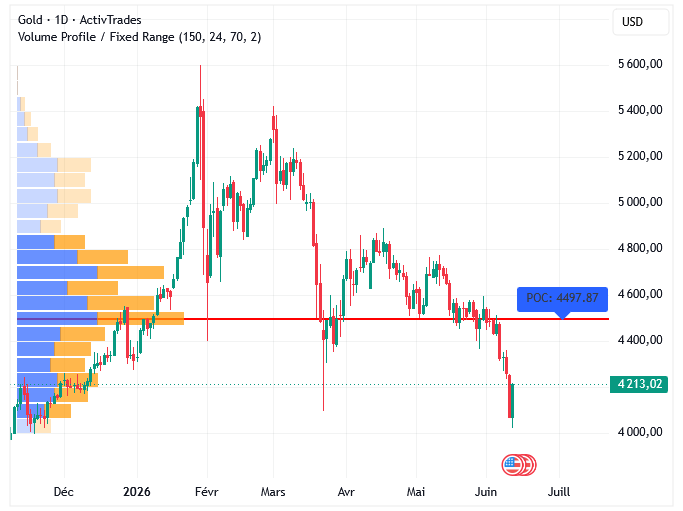
To trade using Market Profile, focus on value area behaviour, rejections, and volume participation.
- Long setup: Look for a long position if the price is trading above the value area or breaks through the top of that zone (VAH), as this indicates that buyers are willing to pay above fair value.
- Short setup: Look for a short position if the price is trading below the value area or breaks through the bottom of that zone (VAL), as sellers are willing to sell below intrinsic value.
- Range trading setup: When the market is trading within the value range between VAH and VAL, it is likely to remain sideways. In this case, traders may adopt a strategy of selling at resistance and buying at support.
- Breakout setup: A breakout outside the value area, accompanied by strong momentum and confirmation candles, often signals a trend extension and a change in direction.
Intraday traders watch the Initial Balance closely, as breakouts from this early-session range often set the tone for the day. It is worth noting that Market Profile performs best on liquid, high-volume instruments.
| Market Profile Summary Table | |
|---|---|
| Category | Price and volume analysis tool |
| Type | Contextual/analytical tool |
| Optimal use | Identifying value zones, support/resistance, and market structure |
| Market conditions | Trending and ranging markets |
10. Money Flow Index (MFI)
The Money Flow Index (MFI), also known as the volume-weighted RSI, is a volume-based momentum oscillator that combines price and volume to calculate buying and selling pressure. Unlike the RSI, which uses only price movements, the MFI incorporates volume alongside price to generate more reliable signals.
Like the RSI, the MFI oscillates between 0 and 100, indicating overbought and oversold zones.
- A value above 80 suggests an overbought condition, indicating a possible decline.
- A value below 20 suggests an oversold condition, indicating a possible bounce.
- Between 20 and 80, the market is trading in a balanced zone, with no extreme buying or selling pressure.
Extreme MFI values often appear during panic selling or emotional buying.
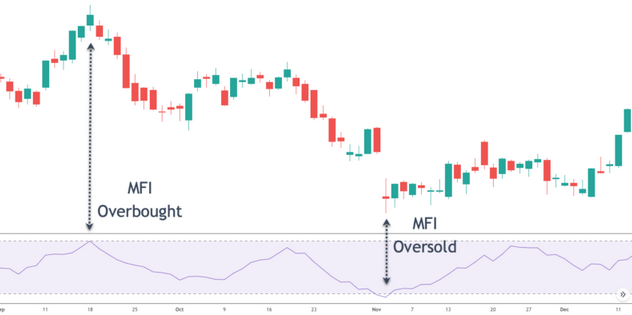
- Long setup: Look for a long position in oversold conditions (below 20) and enter after bullish confirmation (bullish candle, bounce off support, or reversal pattern).
- Short setup: Look for a short position in overbought conditions (above 80) and enter after bearish confirmation (bearish candle, rejection of resistance).
- Divergence setup: When price and the MFI move in opposite directions, this suggests the current trend is losing momentum and a reversal may be imminent. For example, if the price reaches a new high whilst the indicator reaches a lower high, a bearish divergence forms, signalling a potential bullish reversal.
- Trend confirmation: A rise in price supported by a rising MFI indicates strong buyer participation driving the trend.
Extreme MFI peaks often identify emotional buying spikes or panic selling more effectively than the RSI, as the MFI incorporates the strength of participation through volume.
| MFI Summary Table | |
|---|---|
| Category | Volume-based momentum oscillator |
| Type | Leading indicator |
| Optimal use | Analysing overbought/oversold conditions and volume strength |
| Market conditions | Consolidating and reversing markets |
11. Choppiness Index
The Choppiness Index is a volatility-based indicator that helps traders understand the market environment - specifically whether it is trending or in a consolidation phase. Unlike other trend indicators that indicate a direction, the Choppiness Index reflects only the strength of consolidation or trending conditions, without specifying direction.
The value of the Choppiness Index oscillates between 0 and 100, with the levels 61.9 and 38.1 serving as key thresholds derived from the Fibonacci ratio.
- A value above 61.9 suggests a choppy or sideways market, characterised by a balance between buyers and sellers.
- A value below 38.1 suggests a strongly trending market.
- Between 38.1 and 61.9, a transitional phase is observed.
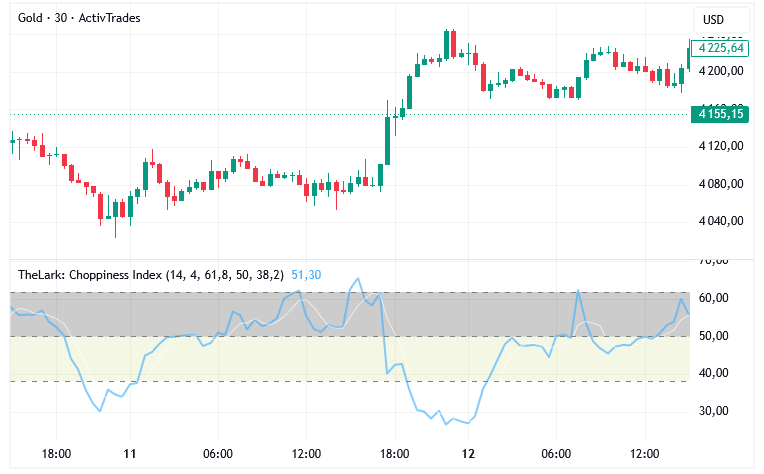
To trade using the CHOP, combine it with trend indicators, price action analysis, or breakout setups.
- Trending market setup: Look for trending opportunities when the CHOP drops below the 38.1 level. As noted above, the CHOP measures the strength of a move rather than its direction, so use it in conjunction with moving averages, breakouts, or momentum indicators to confirm your decisions.
- Ranging market setup: When the CHOP value exceeds 61.9, favour range trading or mean reversion strategies, as the market is likely to continue consolidating between support and resistance zones.
- Breakout setup: Following a prolonged consolidation phase, a sharp drop in the CHOP often signals the beginning of a directional breakout. Avoid trading breakouts when the CHOP value is high, particularly in intraday trades.
- Trend exhaustion setup: If the market is in a strong trend and the Choppiness Index begins to rise again, this may indicate a slowdown in momentum or an imminent consolidation phase.
Its primary value lies in strategy selection. Traders use high index values for mean reversion systems and low values for breakout-based systems. It therefore acts more as a market regime detector than a direct entry point indicator.
| Choppiness Index Summary Table | |
|---|---|
| Category | Volatility and trend indicator |
| Type | Lagging indicator |
| Optimal use | Identifying trending and non-trending (sideways) markets |
| Market conditions | Non-trending and transitional markets |
12. The Darvas Box Theory
The Darvas Box Theory, developed by Nicolas Darvas, is a trading method based on price action. It posits that the price moves within a defined price range before making a significant directional breakout. This approach allows traders to remain positioned within a strong trend until it reverses.
The Darvas Box is drawn by defining the price range using recent swing highs and swing lows, whilst price fluctuations within that range are considered a consolidation phase.
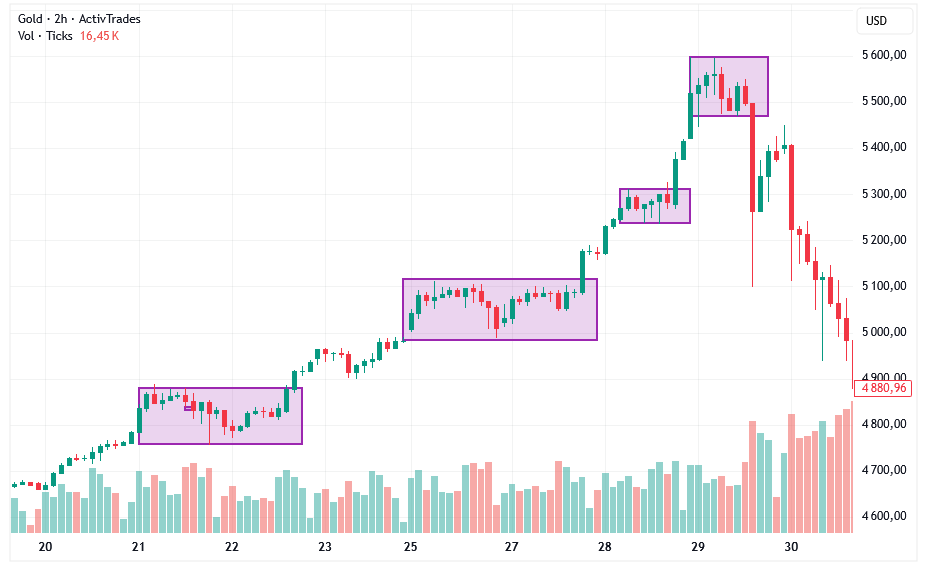
The Darvas Box Theory is primarily used for momentum and breakout trading. Traders typically monitor the consolidation phase within the box, the breakout, and volume confirmation.
- Long setup: Enter a long position when the price breaks above the upper boundary of the Darvas Box on significant volume. Place the stop-loss below the lower boundary of the box.
- Short setup: Enter a short position when the price breaks below the lower boundary of the Darvas Box on significant volume. Use the upper boundary of the box as the stop-loss level.
- Trend trading: In a strongly trending market, Darvas Boxes form in succession. Each breakout forms a new box and presents a fresh entry opportunity. You can follow the market trend until the price breaks the Darvas Box in the opposite direction to the trend.
The Darvas Box strategy works best in trending markets, with high-momentum stocks and breakout scenarios. Avoid trading Darvas Box breakouts when volume is low. This strategy typically has a modest success rate, but can deliver significant gains on winning trades.
| Darvas Box Method Summary Table | |
|---|---|
| Category | Breakout trading indicator |
| Type | Lagging indicator |
| Optimal use | Identifying breakouts and trend continuation |
| Market conditions | Strongly trending markets |
13. Ichimoku Cloud
The Ichimoku Cloud is an all-in-one indicator that combines trend direction, support and resistance levels, momentum, and potential reversal zones within a single system. Unlike other traditional indicators, the Ichimoku Cloud offers a comprehensive view of market structure through several lines and a cloud formation.
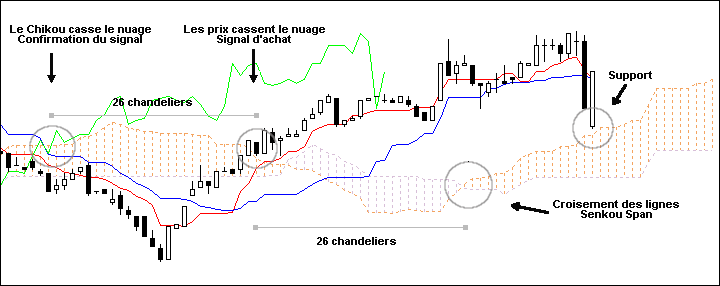
The Ichimoku Cloud consists of four main elements, briefly described below:
- Tenkan-sen (Conversion Line): Indicates short-term market momentum.
- Kijun-sen (Base Line): Indicates medium-term trend direction.
- Senkou Span A and B (Cloud): The cloud represents a zone of equilibrium between buyers and sellers and acts as dynamic support or resistance. A thick cloud generally constitutes a stronger support or resistance zone, whilst a thin cloud can be broken more easily.
- Chikou Span (Lagging Line): Compares the current price to past price action to confirm whether momentum supports the trend.
When the price is trading above the cloud, this indicates an uptrend; when it is trading below, this indicates a downtrend. The interaction of these elements with the price generates actionable trading signals, useful for intraday trading.
- Long setup: Enter a long position when the price moves above the cloud and the Tenkan-sen crosses above the Kijun-sen. The uptrend is further confirmed if the projected future cloud is also bullish.
- Short setup: Enter a short position when the price moves below the cloud and the Tenkan-sen crosses below the Kijun-sen. Here, the downtrend is further confirmed if the projected future cloud is also bearish.
- Dynamic support and resistance: As the cloud helps identify trends, it also functions as a dynamic support and resistance zone. The cloud acts as support during a strong uptrend and as resistance during a strong downtrend.
The Ichimoku indicator is particularly effective in trending markets, when traders are looking for a single system that combines trend direction analysis, momentum, and support and resistance levels.
| Ichimoku Cloud Summary Table | |
|---|---|
| Category | Trend-following indicator |
| Type | Leading and lagging indicator |
| Optimal use | Trend direction analysis, momentum, and support/resistance |
| Market conditions | Trending markets |
14. Average True Range (ATR)
The Average True Range (ATR) is a volatility indicator that measures the average price movement of a share over a given period. Unlike other indicators that provide information on market direction and buy or sell signals, the ATR indicates whether the market is calm or volatile and determines the appropriate stop-loss size given that volatility, without indicating market direction.
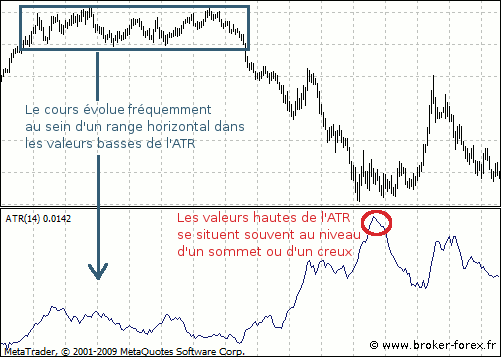
Traders therefore use the ATR to measure volatility, manage position sizing, place stop-loss orders, calculate price targets, and identify breakout expansion.
- ATR for stop-loss: Rather than using a fixed distance for the stop-loss, traders use the ATR value to calculate it based on volatility. To determine the stop-loss level using the ATR, multiply the ATR value of the instrument by a multiplier (1.5 or 2) to obtain the stop-loss distance.
- ATR for position sizing: Once the stop-loss level has been established using the ATR, position size is automatically adjusted according to the risk/reward ratio. When the ATR value is high, traders will typically reduce their position size, whilst during periods of low ATR, they may take larger positions.
- For breakout confirmation: An ATR contraction often occurs during consolidation phases preceding a breakout, whilst an ATR expansion signals an increase in volatility and momentum.
- ATR for price targets: In addition to stop-loss placement, the ATR also helps traders estimate realistic targets. If the ATR value is ₹20, this means the instrument typically moves approximately ₹20 on average over the chosen period.
The ATR is more akin to a risk management indicator than a buy or sell signal indicator. Strategies often gain in consistency when ATR-based exits replace fixed percentage stop-losses.
| ATR Summary Table | |
|---|---|
| Category | Volatility indicator |
| Type | Lagging indicator |
| Optimal use | Measuring volatility and setting stop-loss levels |
| Market conditions | Volatile and trending markets |
How to Choose the Right Indicator for Intraday Trading?
Choosing the right indicator for intraday trading depends entirely on your trading style - whether you wish to trade momentum, trend, volatility, or consolidation. Based on these criteria, indicators are grouped into four categories.
| Indicator type | Purpose | Examples |
|---|---|---|
| Trend | Market direction | EMA, Supertrend |
| Momentum | Speed of movement | RSI, MACD |
| Volume | Participation strength | VWAP, OBV |
| Volatility | Risk and expansion | ATR, Bollinger Bands |
How Reliable Are Intraday Trading Indicators?
| Indicator | Approximate accuracy range | Optimal use case |
|---|---|---|
| Relative Strength Index (RSI) | 55% – 65% | Sideways and reversal markets |
| MACD | 50% – 60% | Trend momentum confirmation |
| Stochastic Oscillator | 55% – 65% | Range-bound markets |
| Exponential Moving Average (EMA) | 60% – 70% | Intraday trend-following setups |
| Average Directional Index (ADX) | 55% – 65% | Measuring trend strength |
| On-Balance Volume (OBV) | 50% – 60% | Volume confirmation |
| VWAP | 65% – 75% | Institutional intraday trading |
| Bollinger Bands | 55% – 65% | Volatility and mean reversion |
| Market Profile | 60% – 75% | Support/resistance and value zones |
| Money Flow Index (MFI) | 55% – 65% | Volume-based momentum analysis |
| Choppiness Index | 50% – 60% | Distinguishing trending from sideways markets |
| Darvas Box Theory | 60% – 70% | Breakout trading |
| Ichimoku Cloud | 60% – 75% | Complete trend-following system |
| Average True Range (ATR) | 65% – 75% | Stop-loss and volatility measurement |
Best Indicator Combinations for Intraday Trading
The best indicator combinations for intraday trading are those in which each indicator serves a distinct purpose. An effective combination of indicators helps traders identify market direction, confirm momentum strength, assess the reliability of a breakout, optimise entry and exit timing, and manage risk more effectively.
The table below presents some commonly used indicator combinations.
| Indicator combination | Purpose |
|---|---|
| EMA + RSI | Trend direction with momentum confirmation |
| VWAP + Volume | Institutional activity and breakout strength |
| MACD + RSI | Trend momentum and reversal confirmation |
| Bollinger Bands + RSI | Volatility with overbought/oversold signals |
| ADX + EMA | Trend strength and trend direction |
| Stochastic + Support/Resistance | Reversal and pullback entries |
| OBV + Price Action | Volume confirmation and breakout validation |
| ATR + Moving Average | Volatility-based stop-loss and trend trading |
The goal of using indicator combinations is not to predict the market perfectly, but to improve the probabilities and quality of intraday trades.
Trading Platforms Offering Intraday Trading Indicators


• ASIC: Australia • BACEN: Brazil • BVIFSC: British Virgin Islands • CBFSAI: Ireland • CMA: Kenya • CySEC: Cyprus • DFSA: Dubai • FCA: United Kingdom • FRSA: Abu Dhabi • FSA: Japan • FSCA: South Africa • FSPR: New Zealand • JFSA: Japan • KNF: Poland • OCRI: Canada • SFC: Colombia
⚠️ CFD trading involves a significant risk of loss. 70 to 80% of retail investor accounts lose money when trading CFDs.
Conclusion
Intraday trading indicators are valuable decision-support tools, but they should never be used in isolation. The most successful traders look above all for a convergence of signals, combining several approaches: trend, momentum, volatility, volume, and technical levels. This complementarity helps filter out false signals and improve the quality of trade entries.
It is also essential to adapt indicator parameters to your trading style, the market being traded, and the timeframe used. A strategy that works well on forex will not necessarily be optimal for indices, shares, or cryptocurrencies. Before committing real capital, take the time to test your indicator combinations on a demo account or via backtesting, in order to verify their relevance across different market conditions.
Risk warning: CFD trading involves a significant risk of loss and is not suitable for all investors. 70 to 80% of retail investor accounts lose money.
Affiliate links: This site uses affiliate links. By registering or purchasing through these links, you support us at no extra cost to yourself. These commissions help fund our work and ensure independent content. Thank you for your trust!
