17 trading configurations: A guide for new traders

A trading configuration plays a crucial role by bringing discipline, clarity, and repeatability to trading decisions.
It provides traders with a predetermined set of rules, removing subjectivity and ensuring that every trade is based on rigorous planning.
Its importance lies in the consistency and risk control it enables.
A standardised configuration allows traders to identify high-probability trades, quantify performance, and optimise execution over time.
It reduces the influence of emotions by eliminating impulsive decisions. A clear trading framework transforms speculative, reactive trading into professional, structured trading focused on capital preservation and long-term results.
What is a trading configuration?
A trading configuration is a predefined set of market conditions that a trader waits for before entering a position. It clearly defines when to enter, when to exit, and how much risk to take, based on a specific strategy, rules, and market context.
Summary of the main trading configurations
The table below summarises the main trading configurations that we'll discuss.
| Trading configuration | What is it? | Optimal timeframe | Best for | Risk level |
|---|---|---|---|---|
| VWAP trading | Use rejections or bounces around VWAP to identify an intraday trend | 1 to 5 minutes | Intraday traders | Medium |
| Breakout | Enter when price breaks key support or resistance levels | 5 to 15 minutes - 1H | Momentum traders | High |
| Reversal | Trade trend changes at extreme or major levels | 15 min - 4H | Experienced traders | High |
| Pullback | Enter after a retracement within an ongoing trend | 5 min - 1H | Trend traders | Medium |
| Trend following | Trade established long or short trends | 1H - Daily | All traders | Medium |
| Chart patterns | Trade chart patterns (head and shoulders, triangles, flags) | 15 minutes - Daily | Pattern-focused traders | Medium |
| Break of structure (BOS) | A structure shift based on SMC confirms a trend change | 1 to 15 minutes | Skilled traders | High |
| Order blocks | Use institutional supply and demand levels | 1 to 15 minutes | SMC / ICT traders | High |
| Moving average crossover | Buy or sell when the short moving average crosses the long moving average | 1H – Daily | Beginners | Low to medium |
| Fair Value Gap (FVG) | Price fills an imbalance zone before the trend resumes | 1 to 15 minutes | ICT / PA traders | Medium to high |
| Gap trading | Trade gap fills or trend continuation after a bullish or bearish gap | 1 to 5 minutes - Daily | Intraday and swing traders | High |
| Divergence configuration | Use RSI or MACD divergence to identify trend reversals | 15 minutes - Daily | Intermediate traders | Medium |
| Volume spike | Use sudden volume spikes that signal market moves | 1 to 15 minutes | Momentum scalpers | Medium to high |
| Mean reversion | Bet on price returning to the average after a deviation | 5 min - 1H | Range traders | Medium |
| Supply and demand zones | Trade market turning points around major spread zones | 5 min - 4H | PA and SMC traders | Medium to high |
| Pivot points | Use daily or weekly pivot levels to identify bounces and trend reversals | 5 to 15 minutes | Intraday traders | Medium |
| Bollinger Squeeze | Trade a volatility contraction followed by an expansion | 5 min - 1H | Breakout traders | Medium |
Many trading configurations exist across different timeframes and markets, but the 17 most commonly used configurations are presented below.
1. VWAP trading configuration
The VWAP (Volume Weighted Average Price) is a trading configuration based on the volume-weighted average price. VWAP helps traders determine whether an asset’s price is overvalued or undervalued. Traders use VWAP as dynamic support or resistance to optimise entry and exit points, especially in intraday trading.
The use of VWAP began over 45 years ago on institutional trading desks. As charting platforms evolved, VWAP became accessible to retail traders.

The chart above clearly illustrates how VWAP acted as support for a stock in an uptrend. The stock retraced to VWAP, formed an inverted head and shoulders pattern, and continued its trend while leaning on VWAP.
Pros and cons of a VWAP-based trading strategy
| Pros | Cons |
|---|---|
| Widely used by institutions and professionals | Less effective in strongly trending markets |
| Provides an objective volume-based reference | Intraday VWAP resets daily |
| Ideal for intraday trading and scalping | False signals in low-liquidity conditions |
| Works as dynamic support and resistance | Not suitable for long-term trading |
| Easy to combine with price action analysis | Requires sufficient volume to be reliable |
2. Breakout configuration
The breakout configuration is a trading approach that involves buying or selling an asset when its price clearly breaks a support, resistance, or chart pattern. The idea behind this configuration is that a break of a key level often triggers a trend. Popularised by Richard Danchian, it was later refined by trend-following and momentum traders.

Above is the chart of a stock that faced multiple resistance tests between 710 and 720. After breaking those resistance levels, the stock rose by more than 25%. A trader can use this type of breakout to benefit from market momentum.
Pros and cons of a breakout-based trading strategy
| Pros | Cons |
|---|---|
| Captures strong momentum moves | High risk of false breakouts |
| Clearly defined entry and stop-loss levels | Requires patience and discipline |
| Works across all markets and timeframes | Underperforms in choppy markets |
| Favorable risk-to-reward potential | Slippage during fast moves |
| Easy to combine with volume and VWAP | Emotional stress during resistance retests |
3. Reversal configuration
The reversal configuration is a trading approach where the trader identifies the turning point of an existing trend. In reversal trading, traders look for momentum exhaustion, a loss of momentum, or a strong rejection of a key level to capture a move from the reversal point.
The reversal configuration has been used since the early days of classical market theory, when traders observed that markets move in cycles of contraction and expansion.
The chart above clearly shows how the stock reversed from a downtrend to an uptrend after forming an inverted head and shoulders reversal pattern. A trader can use such trend reversals to anticipate a new direction.
Pros and cons of a reversal-based trading configuration
| Pros | Cons |
|---|---|
| Entry close to market extremes | High risk of false signals |
| High profit potential | Requires strong confirmation |
| Tight stop-loss if timing is good | Emotionally difficult to manage |
| Works well at key support and resistance | Underperforms during strong trends |
| Excellent for swing trading and position trading | Demands experience and patience |
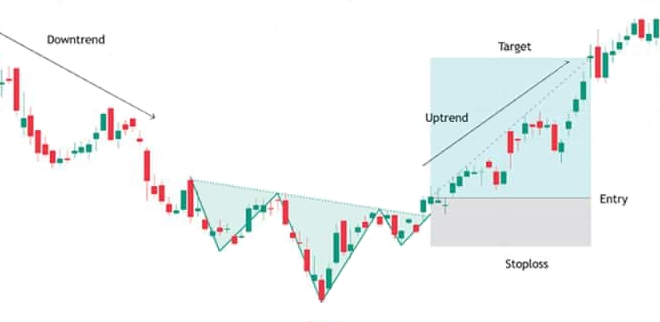
4. Pullback configuration
The pullback configuration in trading involves buying or selling an asset in the direction of the dominant trend after a temporary pullback in price. Instead of chasing upward momentum, traders wait for price to reach a value area, such as support or a moving average, before entering a position.
The pullback concept was formalised through tools such as Dow Theory, moving averages, and retracement techniques.

The chart above clearly shows the stock is in an uptrend, with higher highs and higher lows. When a stock pulls back within an uptrend, investors buy the shares at a discount, anticipating another leg higher. These strategies allow investors to follow the market trend and improve their chances of success.
Pros and cons of a trend-following strategy
| Pros | Cons |
|---|---|
| Trading opportunities in the direction of the trend | Requires patience |
| Better entry price than breakouts | Risk of missed trades if the pullback is shallow |
| Lower risk than reversal strategies | The pullback can turn into consolidation |
| Works well across all timeframes | False signals in weak trends |
| Easy to combine with moving averages and RSI | Overtrading during high volatility |
5. Trend-following strategy
Trend following is a trading approach where the trader identifies an established trend and enters in the same direction to follow it until it reverses. This strategy focuses primarily on price structure, such as sequences of higher highs and higher lows, or lower highs and lower lows, and involves staying in the trend until it shows signs of exhaustion.
Trend following is one of the oldest trading methods, used since Dow Theory. It was later systematised by traders such as Rich Danchien and the famous Turtle Traders.
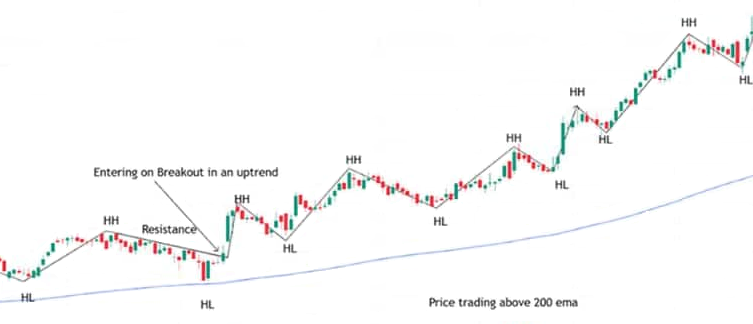
As the chart above clearly shows, the stock is in an uptrend, trading above the 200-period exponential moving average (EMA 200), with progressively higher highs and higher lows. If a trader entered long after the consolidation phase ended, they would still be in the trade, because no sign of a trend reversal is visible.
Pros and cons of a trend-following strategy
| Pros | Cons |
|---|---|
| Captures large directional moves | Underperforms in low-volatility markets |
| Simple and rules-based | Late entries after trend confirmation |
| Works across all asset classes | Multiple small losses |
| Less emotionally stressful | Requires patience and discipline |
| Highly scalable strategy | Large losses can challenge confidence |
6. Chart pattern configuration
The chart pattern configuration is a trading approach that identifies recurring structures formed by market psychology. This configuration helps anticipate the next market move based on the current psychological behavior of buyers and sellers. In this type of configuration, the entry point is typically defined after an upside or downside breakout.
The use of chart patterns in trading originates in classical technical analysis. This concept was later formalised by Charles Dow, then documented by Edwards and Magey in the mid-20th century.

The chart above illustrates trading flag and pennant patterns. A stock in a strong uptrend consolidated to form a flag pattern before continuing higher. Traders could have taken a long position after the pattern breakout, with a profit target of 1:2 or equal to the length of the flagpole.
Pros and cons of chart-pattern-based trading
| Pros | Cons |
|---|---|
| Visual and easy to understand | Subjective interpretation |
| Clearly defined entry, stop, and target levels | False breakouts are common |
| Works across all markets and timeframes | Requires experience to master |
| Reflects market psychology | Patterns fail when volume is low |
| Compatible with other indicators | Overreliance on pattern symmetry |
7. Break of structure (BOS) configuration
The break of structure (BOS) configuration is a price action-based configuration. It involves identifying a decisive break of a previous market structure, such as a prior high or low. This BOS signals a shift in control from buyers to sellers or vice versa, helping traders confirm the market trend.
The BOS concept originates in price action analysis and market structure, used by traders long before indicators were introduced. In recent years, BOS has been widely recognised in institutional trading models and "Smart Money - SMC" strategies.

The chart above clearly illustrates seller dominance after the break of the previous low. Traders took a short position as soon as sellers broke the stock price. This could have produced a 1:2 profit.
Pros and cons of the BOS trading strategy
| Pros | Cons |
|---|---|
| Objective, price-based signals | Requires precise structure identification |
| Clear confirmation of trend direction | False breaks in range-bound markets |
| Precise stop-loss placement | Late entries during continuation |
| Works perfectly with order blocks and liquidity | Requires multi-timeframe analysis |
| Effective across all markets | Overuse leads to overtrading |
8. Order block configuration
The order block configuration is a price action-based trading strategy. It focuses on key price zones where institutional buying and selling is assumed to have occurred before a major directional move. Traders view these zones as high-probability areas of interest, anticipating a quick price reaction when they are revisited.
The order block concept originates in institutional investor theory (Smart Money), which states that large investors cannot enter or exit positions at a single price, creating a zone where institutions accumulate significant positions. In recent years, order blocks have gained popularity through the Smart Money (SMC) concept and among experienced traders using price action analysis.

The Bitcoin chart above clearly illustrates how price finds support at order blocks. A trader can identify such an order block and execute the trade on a lower timeframe to optimise the risk-to-reward ratio.
Pros and cons of order-block-based trading
| Pros | Cons |
|---|---|
| Aligned with institutional practices | Subjective identification |
| High profit potential | Requires context and confirmation |
| Precise entry points and stop-loss levels | Ineffective in volatile markets |
| Works well with liquidity indicators and key performance indicators (BOS) | Overcomplication reduces clarity |
| Effective across all time horizons | Requires experience to master |
9. Moving average crossover configuration
The moving average crossover configuration is a trend-trading strategy based on an indicator. The trader enters or exits a position when the short-term moving average crosses the long-term moving average from above or below. A short-term crossover from above indicates a buy signal. Conversely, a bearish crossover occurs when the short-term moving average crosses the long-term moving average from below.
Moving average crossover techniques gained popularity with automated trading systems in the mid-20th century. They were later adopted by commodities traders, hedge funds, and algorithmic strategies due to their simplicity and adaptability across markets.

The chart above clearly illustrates a simple buy and sell signal generated by the crossover of exponential moving averages (EMA). When the short-term EMA crosses the long-term EMA from above, the trend becomes bearish, giving traders the opportunity to sell short. Conversely, when the short-term EMA crosses the long-term EMA from above, it generates a buy signal.
Pros and cons of the moving average crossover configuration
| Pros | Cons |
|---|---|
| Simple and rules-based | Lagging indicator |
| Effective in trending markets | Frequent false signals during consolidation |
| Easy to automate and backtest | Late entries and exits |
| Works across all asset classes | Misses the start of the move |
| Reduces emotion-driven decisions | Drawdowns during consolidation phases |
10. Fair Value Gap (FVG) setup
The Fair Value Gap (FVG) setup is a price action-based strategy that exploits price inefficiencies created by aggressive buying or selling. FVG strengthens when prices move impulsively, creating a gap or imbalance between two consecutive candles. The trader anticipates a return of price into this imbalance zone to rebalance liquidity before the trend continues.
FVG gained popularity with the rise of institutional algorithmic trading in the early 1990s and became widespread among traders through the “Smart Money” concept after 2018.

On this chart, copper is in a downtrend, forming lower highs and lower lows. As a low formed, price dropped sharply, leaving an FVG level. As soon as price returned to that level, it dropped sharply again, producing a 1:2 risk-to-reward ratio.
Pros and cons of the FVG trading setup
| Pros | Cons |
|---|---|
| Clearly defined imbalance zones | Not all FVGs get filled |
| Strict stop-loss placement | Requires market context analysis |
| Strong institutional logic | Over-sizing reduces precision |
| Works well with order blocks and consolidation strategies | Underperforms in low-volatility periods |
| Effective across all timeframes | Requires experience to optimise |
11. Gap trading strategy
The gap trading strategy is based on exploiting price gaps created by an open significantly higher or lower than the previous session’s close. These gaps reflect an abrupt shift in market sentiment, often driven by news, earnings, or global factors. Traders seek to profit from these gaps, either by trading continuation or by trading the gap fill.
Gap trading became popular with the rise of electronic exchanges and overnight trading in the late 1990s and early 2000s. This strategy saw mass adoption among retail traders after 2010, as intraday traders exploited gaps using volume and price analysis.

On 18 January 2025, Infosys opened down 3.7%, before the price slowly rose to fill the gap and then resumed its downtrend. After that gap fill, the stock plunged by over 19%. Traders could have anticipated a short sale after the gap fill and the break of the support line.
Pros and cons of a gap trading strategy
| Pros | Cons |
|---|---|
| Quick intraday opportunities | Highly volatile |
| Clear trend from market open | Susceptible to slippage |
| Optimal accuracy with volume analysis | False decisions in the first few minutes |
| High momentum potential | Requires fast execution |
| Popular on stocks and indices | Emotionally draining |
12. Divergence Setup
The divergence setup involves identifying a disconnect or disagreement between price movement and momentum indicators. When prices reach new highs or lows while the indicator moves in the opposite direction, it suggests weakening momentum and a possible pause or trend reversal. Traders use this setup to identify potential trend reversals.
The concept of divergence trading developed alongside momentum indicators such as the RSI and MACD in the 1980s. Its practical application saw a sharp increase after 2010, when traders began combining divergence with price action and price structure analysis for greater precision.

As can be seen on the chart above, the stock was progressing upwards, reaching new highs. However, despite this progression, the strength of the rise was insufficient, as the RSI was trending downwards, indicating low vigour in the movement. This divergence led to a price correction after a lower support level was broken. A trader can exploit this type of setup for a trend reversal trade.
Pros and cons of a divergence-based trading setup
| Pros | Cons |
|---|---|
| Early signal of weakening momentum | Not a standalone timing tool |
| Relevant during trend reversals and pullbacks | Many false signals in strong trends |
| Combines effectively with RSI and MACD | Requires confirmation |
| Clear visual identification | Subjective interpretation |
| Effective across all timeframes | Excessive use leads to overtrading |
13. Volume Spike Setup
The volume spike setup focuses on a sudden and abrupt change in volume compared to recent average volume. A volume spike suggests strong participation or institutional activity, which often appears near breakouts, trend reversals, or key support and resistance levels. Traders use volume spikes as confirmation following a price variation.
The volume spike setup gained popularity with the rise of electronic markets in the 2000s. After 2009, real-time volume data and intraday platforms made it easier for retail traders to identify abnormal volumes.

As shown in the chart above, a strong surge in volume is observed, exceeding the average of the last 30 days. This suggests institutional participation, leading to a strong price progression. Traders can profit from these movements by analysing volume and price structure.
Pros and cons of a volume spike-based trading strategy
| Pros | Cons |
|---|---|
| Confirms genuine market interest | Not a standalone entry signal |
| Helps avoid false exit signals | Can be misleading around economic announcements |
| Works well with price action analysis | Requires context and experience |
| Useful across all timeframes | Confirmation can sometimes be late |
| Highlights institutional activity | Overreaction to certain candles |
14. Mean Reversion Setup
The mean reversion setup is a trading strategy based on the idea that price tends to return to its average value after a strong move in one direction. Traders look for overbought or oversold situations, anticipating a reversal or correction towards a mean, such as the VWAP, moving averages, or statistical bands. They look for a buying opportunity after a sharp drop in price when a return to the mean is expected. Conversely, they plan to sell when the price rises sharply.
Mean reversion concepts were developed via statistical and financial research in the 1970s and 1980s, and saw significant application in the 2000s, particularly among quantitative and proprietary trading desks. Its use by discretionary traders has increased since 2009, with the simplified use of other indicators such as Bollinger Bands and VWAP to identify overbought/oversold conditions.
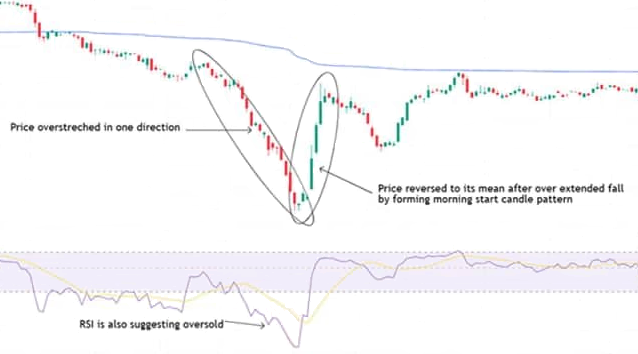
The chart above illustrates the price returning to its average value (VWAP) after an excessive drop in one direction. An RSI below 30 indicates an excessive price decline, signalling that traders would have anticipated a trend reversal following a bullish candle.
Pros and cons of a mean reversion strategy
| Pros | Cons |
|---|---|
| Clear logic and precise objectives | Poor performance during strong trends |
| Performs well in low-volatility markets | Requires precise timing |
| Precise stop-loss placement | Frequent, albeit small, losses |
| Easy to combine with VWAP and BB | Emotionally challenging |
| Favoured by professional desks | Requires rigorous risk management |
15. Supply and Demand Zones Setup
The supply and demand zones setup involves identifying price areas where strong buying and selling pressures have manifested, causing a marked directional move. These zones represent an imbalance between buyers and sellers, and traders anticipate a return of prices to these zones, making them useful for entry points, exit points, and risk management.
Supply and demand analysis stems from classical price action theory, but zone-based trading gained popularity in the late 1990s. Its adoption accelerated after 2009, as traders began identifying zones rather than single price levels to reflect institutional order execution.

Pros and cons of setting up a supply and demand zone
| Pros | Cons |
|---|---|
| Reflects true imbalance between buyers and sellers | Subjective marking of zones |
| Clearly defined entry and stop-loss zones | Weak zones identified after multiple tests |
| Works well with trends and market structures | Requires multi-timeframe analysis |
| High profit potential | Ineffective in low-volume markets |
| Effective across all asset classes | Requires experience to master |
16. Pivot Points Setup
The pivot points setup is primarily used by short-term or intraday traders. They exploit supports and resistances calculated mathematically from the price movement of the previous session. In this setup, the central pivot point serves as the average level, with supports (S1, S2) and resistances (R1, R2). Traders enter a position when the price breaks through or bounces off these support or resistance levels.
Pivot points were introduced by floor traders in the 1980s-1990s to quickly identify support and resistance levels. Their popularity exploded after 2009 with the rise of electronic platforms.

On the chart above, it can be observed that the share price broke through resistance (R2), indicating a bullish trend. A long position is considered after the candle closes above resistance (R2), with the next resistance (R3) as the target and the previous low as the stop-loss.
Pros and cons of the pivot point bounce setup
| Pros | Cons |
|---|---|
| Predefined objectives | Weak during trending periods |
| Popular with intraday traders | False bounces near economic announcements |
| Easy trade planning before market open | Requires confirmation |
| Works well with volume and RSI | Over-analysis of multiple pivot points |
| Clear targets and stops | Limited profit potential |
17. Bollinger Squeeze Setup
The Bollinger Squeeze is a volatility-based trading setup. Traders identify periods of low and high volatility using Bollinger Bands. A narrowing of the bands indicates low volatility, signalling price preparation for a significant directional move. When the price breaks out of this squeeze zone, it heralds a strong directional expansion, accompanied by a widening of the bands.
Bollinger Bands were introduced in the early 1980s by John Bollinger, while the Bollinger Squeeze concept gained popularity in the 2000s. Its use by retail traders increased after 2006 with the rise of digital technology.

As clearly seen on the chart above, the share price is moving sideways and the Bollinger Band is narrowed due to low volatility. When the price broke through the upper limit of the Bollinger Band with a strong candle, it started a bullish trend, with the Bollinger Band widening. This indicates a rise in volatility and momentum, favourable for directional traders.
Pros and cons of the Bollinger Band Squeeze setup
| Pros | Cons |
|---|---|
| Quickly detects volatility expansion phases | Uncertain direction |
| Performs well in consolidation phases | Possible false alerts |
| Clear visual structure | Requires confirmation |
| Effective across all timeframes | Underperformance during high-volatility periods |
| Comparable to volume and trend analysis | Patience required |
Which indicators perform best for your trading setups?
No indicator is universal, as their effectiveness depends on the trading style (intraday, swing trading, or options). Traders generally combine different indicators, such as the Exponential Moving Average (EMA) for trend, RSI and MACD for momentum, and volume for confirmation, to increase the reliability of their strategies.
Here are a few of the most used indicators in trading setups.
| Indicator | Ideal for | Why is it effective? |
|---|---|---|
| EMA (9 / 20 / 50) | Trend setups, crossovers | Acts as dynamic support and resistance. The combination of 9-20-50-200 Exponential Moving Averages (EMA) effectively filters trend direction and optimises entry timing in trending markets. |
| RSI (14) | Momentum, divergences | Identifies momentum, strength, and exhaustion. Particularly effective in patterns such as double tops/double bottoms. |
| MACD (12, 26, 9) | Crossovers, reversals | Confirms changes in momentum and breakout strength. Works best when aligned with EMA trends, especially for early detection of exhaustion levels and trend reversals. |
| Volume | Breakouts, confirmations | Validates price movements by measuring participation. Breakouts with volume exceeding 150% of the average significantly reduce false signals and improve reliability. |
| Bollinger Bands | Volatility breakouts | Identifies volatility contraction and expansion. Narrow bands, followed by MACD confirmation, often precede significant directional moves, particularly on indices and mid-cap stocks. |
Traders use the indicators mentioned above in combination to filter high-probability setups, confirm trends and momentum, validate breakouts, and improve timing, thereby making their trades more reliable and consistent.
What makes a high-probability trading setup?
The following main factors characterise a high-probability setup:
1️⃣ Market Context: A setup is optimal when it aligns with the market trend, range, or volatility expansion. Trading against the trend increases the risk of failure.
2️⃣ Confluence: High-probability trades are those that combine various conditions, for example, price activity at support/resistance levels with indicators such as EMA, RSI, or VWAP.
3️⃣ Clear Risk/Reward Ratio: Each trade must offer a specified return, ideally 1.5 to 2 times the risk. This makes it profitable even with moderate success rates.
4️⃣ Volume and Participation: High volume is an indicator of institutional participation. The absence of volume on breakouts or reversals usually catches traders out.
5️⃣ Alignment with Higher Timeframes: Entries made on lower timeframes are more effective when they align with the trend or key values of the higher timeframe.
6️⃣ Statistical Validation: A strategy must be backed by data: a success rate of at least 50% or a profit ratio greater than 1.5 over a significant sample.
When these elements work together and are validated by data, the strategy offers reproducible results and consistency in long-term trading.
FAQ
Which trading setup is most suitable for beginners?
Moving average crossover setups are ideal for beginners and are among the easiest stock market terms to grasp. This setup facilitates execution and trend following. Its simplicity allows new investors to focus on discipline and risk management, avoid being overwhelmed, and gain a solid understanding of market trends and momentum.
Which trading setup is the best when day trading?
The VWAP setup is ideal for day trading. In intraday, VWAP serves as a reference for price value. A price rise above the VWAP, accompanied by a volume spike, indicates momentum and institutional buying.
This setup offers clear entry and exit guidelines with tight stops, ideal during high-frequency sessions, particularly on a 5 to 15-minute chart. It is therefore a wise choice for day traders. It reduces uncertainty and the impact of emotions when markets are volatile.
Which trading setup is ideal for forex trading?
The multi-timeframe confluence setup is ideal for Forex trading. This setup offers a distinct advantage in a volatile currency market by aligning trends across multiple timeframes.
This strategy ensures that trades are made in the direction of the main trend, confirms momentum, and allows for precise placement of stop-loss orders on the lower timeframe while targeting the move on the higher timeframe. A Forex trader can thus optimise their risk/reward ratio.
Which trading setup is most suitable for stock trading?
The Pullback setup is ideal for stock trading, as stocks often perform a retracement before continuing their trend, making pullbacks perfect for structured entries.
This setup allows traders to buy with a precise level of risk - using the low of the retracement as a stop loss - while targeting the continuation of the trend. This is how many experienced traders structure their entries. It is effective for both swing trading and short-term trading.
Which trading setup is the best crypto trading?
The multi-timeframe confluence setup is the most suitable for cryptocurrency trading, as crypto markets are highly volatile and frequently generate false signals. The convergence of multiple timeframes helps avoid traps, aligns trades with the overall trend, and increases the chances of success. This setup will suit both swing traders and intraday crypto traders, thanks to its clarity during volatile periods.
| Previous: Position sizing - Calculating position sizes | Next: Forex trading plans |
