How to set your stop-loss and take profit targets

The art of placing your stop-loss levels and take profit levels is a fairly broad subject. This article doesn't cover everything detail, but it will give you a good overview of the most important things you need to know.
Where does one place a stop-loss?
Let's talk about the stop-loss first. This is because you should always think about what you're willing to risk before thinking about any potential profit you stand to make. Secondly, you need to determine your stop-loss level (and thus your potential loss) and then determine the lot size you're going to trade (and thus your potential profit), as well as your "R" multiples.
Stop-loss levels: general theory
A stop-loss must be placed at a logical price level: a price that tells us that our trading signal is no longer valid and that will make sense in the context of the current market environment.
The first option is thus to let the market liquidate the position, which means that the market will indicate whether a trade is no longer valid by reaching price that cancels or modifies the short-term market bias. Closing a trade manually is another option, but it is always better to set and "forget" a trade and let the market do the rest without further human intervention. The only valid reason to exit manually before reaching your predetermined stop-loss is if the market shows convincing price action against the trade idea. However, many traders make the mistake of exiting manually due to excessive fear...
In short, there are two logical ways to exit a trade:
1) Let the market reach your predetermined stop-loss.
2) Exit manually because the price action suggests your trade will not be a good one.
Exits that are due to emotions:
1) Via a margin call, because you didn't set a stop-loss and the market moved against your position. In this case the broker automatically closes your trade.
2) Manual closing of a transaction because you "think" that the market will reach your stop-loss. Your emotions are triggered because the market appears to be moving against you. But there is no reason based on price action to exit the trade manually.
The purpose of a stop-loss is to help you stay in a trade until the initial short-term directional bias is no longer valid. A professional trader places his stop-loss at a level that allows his position room to "breathe", but not without a definite purpose. Basically, when determining the best place to place your stop-loss, you need to think about the closest logical level that the market should reach to prove that your trading signal is no longer valid.
Setting your stop-loss order is one of the most important things you'll do, so you need to take the time to think and determine where your stop-loss should go before you enter into a trade.
Many traders place their stop-loss too close to their point of entry because they want to trade a larger lot size. This is a mistake, because you have to place the stop-loss according to your trading signal and the price action conditions, not according to the amount of money you want to earn.
Always place the stop-loss before determining the size of the position, the placement of a stop-loss must be determined by logic, not by greed. This means that you shouldn't place a small stop-loss on a trade just because you want to trade a large lot size. Many traders do this and it's as if you're preparing to lose before the trade even begins.
Now let's review some examples of logical stop-loss placements.
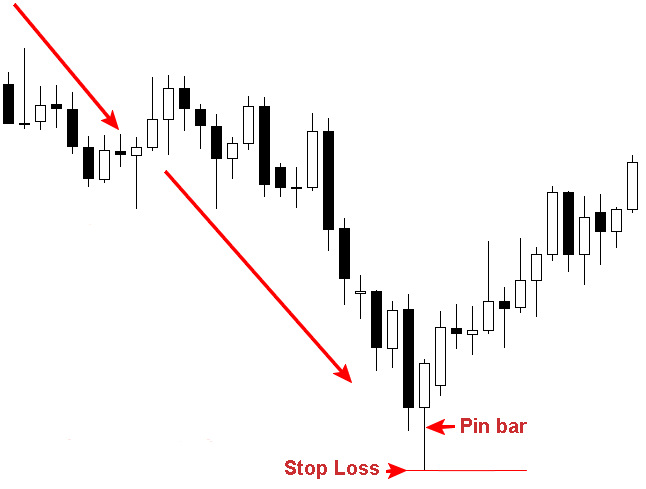
Setting your stop-loss level on a pin bar trading strategy:
The most logical and safest place to place your stop-loss on a pin bar configuration is just beyond the top or bottom of the pin bar's wick. So, in a downtrend (such as the below illustration), the ideal stop-loss should be placed right above the pin bar's wick.

Setting your stop-loss when using an inside pin bar trading strategy:
The most logical and safest place to place your stop-loss is right above the parent pin bar, whether high or low. If you don't understand inside pin bars yet, check out this article: inside pin bar trading strategy.

Setting your stop-loss when using a counter-trend price action strategy:
If you use a counter-trend trading strategy, you should place your stop-loss right above the top or bottom of a configuration signaling a potential trend change. In the below illustration, a downtrend is already in place when we see a major bin par reversal signal. You must place the stop-loss just below the wick of this pin bar.
Setting your stop-loss within a trading range:
We often see price action setups that seem like obvious winners form at the edge of a trading range. In such situations, the stop-loss must be placed just outside the trading range's boundary or the highest or lowest price of the configuration that you see. For example, if you see a pin bar at the top of a trading range that is right below the range's resistance level, you need to place the stop a little higher, just outside the range's resistance level, rather than just above the pin bar's high. In the following illustration, we don't see this problem, because we have a big bearish bar that exceeds the range's resistance level, so the best spot for the stop-loss for this particular configuration is right above the pin bar's wick.

Setting your stop-loss in a trending market:
When a trending market reverses or goes back to a previous level within the trend, you only have two options: 1) you can set the stop-loss right above the bottom or top of the pattern, as we discussed, or 2) you can use this new level and place our stop-loss right beyond this level. You can see an example in the below illustration with the false break trading strategy. Here, the price goes beyond the downtrend's resistance level. The most logical place for the stop would be right above the false break or resistance level.

Setting your stop-loss within the breakout of a trending market:
In a trending market, we can often see prices pause and consolidate laterally after a long climb or descent. These consolidation periods generally lead to major breakouts in the trend's direction, and these breaks can often be quite profitable. Here, we have a few option (as demonstrated by the below illustration with the pin bar): 1) we can place our stop-loss near the 50% level of the range, or 2) we can place it on the other side of the price action setup. The logic behind placing the stop loss near the 50% level of the range is that if the market goes back down to this point, the break is probably not very strong and may fail. This stop-loss placement gives you a tighter stop distance which decreases your risk/reward ratio.

Something to keep in mind regarding your stop-loss placement:
Suppose you have a price action trading strategy that revolves around key market levels. The ideal stop-loss placement will usually be right below or right above the pin bar's wick (as we saw in the preceding examples). However, since price action configurations can be very close to a key market level, common sense dictates that you increase your stop-loss a little and place it right above this key level, rather than at the bottom or top of the pin bar's wick. This way, you ensure that the market violates this key level before you stop, which shows you that the market's sentiment has changed and that you should perhaps seek trades in the other direction. This is how to place a stop-loss: by relying on the market's structure instead of emotions such as fear or greed.
Setting profit targets
Setting profit targets and getting out of a trade is one of the trickier parts of the trading game. The idea is to get out of a trade once you've made a decent profit, rather than wait for the market to turn against you and exit out of fear. The difficulty is that you might not want to exit a trade while your profits are rising because you'll think that the profits will continue to accumulate and because there's no reason to get out. The irony is that not getting out while the trade is in the green probably means that you'll let your emotions define when to get out. You should take profits using a respectable risk/reward ratio of at least 1:2, unless you've already decided that you want to keep the trade going as far as possible.
General theory on how to set profit targets:
After you've found the most logical stop-loss level, you must next think about setting your take-profit level (while keeping in mind the risk/reward ratio). Make sure, though, that a decent risk/reward is possible on a given trade. Also, make sure that you're not ignoring key price levels or obstacles - entering into a trade for the sake of trading is not a good idea.
To determine a take-profit level, you must first analyse overall market conditions and structure, such as support and resistance levels, high and low points, etc. This helps to determine if there is a key level that would achieve a logical profit target, or if there is a key level that blocks the path to making a decent profit.
Example of calculating profit targets based on a risk multiple:
In the below illustration, you'll find a pin bar pattern that formed after a rebound and reversal of the downtrend. The stop-loss was placed just below the pin bar's low. So, at this point, we have what we call R1, or simply the amount in euros that are at risk from our entry price to the stop-loss price. We can then take this amount R1 (our risk) and extend it to find multiples of this amount that we can use as profit targets.

In the below chart, we can see a reversal of the pin bars formed near a key resistance level, suggesting a high probability of a bearish move. The first thing to do is to determine where the ideal spot is to place a stop-loss. Here, this would be right above the pin bar's wick.
Next, we can see that there's a key support level a bit lower. The distance between the entry point and the support level is 1.5 times the risk, and beyond this, there are no key support levels. The trade is worth taking, but since there is a chance of a rebound on this first support level, I decided to go down to the R1 level and lock in this profit. This way I can at least reach R1 level while avoiding the potential reversal of this key support level.
It turned out that the market passed the first key support level and then continued to decline to the R3 level. Now, not all trades work out as well as this one, but I'm trying to demonstrate how to place a stop-loss correctly, how to calculate your R1 risk amount and then find the potential reward multiples of that risk while considering the overall structure of the current market environment. The key levels on the chart should be used as a guide for your profit targets, and if there's a key level of the chart coming in before the trade can secure an R1 profit, then skipping the trade might be worth considering.

A few last words:
Traders are in it for the money. Think of Warren Buffet when he's busy selecting stocks to invest in. He always conducts a risk/profit analysis in order to decide whether the stocks is worth investing in or not. As a trader, you should also be doing that - deciding whether the current market environment is favourable to your hitting the profit target. It doesn't matter if the trade size will only represent a mere £200 or a whopping €125,000, the risk/profit analysis should be done the same way. The same is also true in terms of where you place your take-profit and stop-loss levels.
Holding onto your trading funds should be a leading objective. This means keeping an objective view of the situation. Pros don't waste their funds, they only use them if the risk/profit analysis they've done suggests the trade is worth taking. If you can't justify the risk that a given chart configuration offers, it might be best to just wait for another more attractive opportunity and sit this one out.
