CCI – Commodity Channel Index
The Commodity Channel Index is a technical indicator (also in the oscillator category) that was developed by Donald Lambert in the early 1980s. It identifies cyclical movements in the evolution of prices and can be used to identify overbought and oversold levels. Originally designed to track the commodity market, its use extended to both the futures market and the stock market.
Using the CCI
In order to correctly interpret this indicator, it is important to determine what kind of trend is happening by using other trend indicators such as the MACD, moving averages, etc...
Lambert recommends using 1/3 of a complete cycle for the CCI period calculation. The shorter the CCI period is, the more volatile the indicator is and the more you'll be getting false signals. If you're observing a 60-day grahp, you would use a 20-day CCI - with less than 20 days you'd be getting lots of false signals and with more you wouldn't be getting many signals.
Generating buy or sell signals in market that shows a trend.
Lambert's traditional interpretation of this concept is that whenever the indicator crosses outside of the limits, you can expect to see a market that exhibits enough direction for significant pricing gaps to occur.
Buy signal when the CCI passes above +100, followed by a sell signal once it falls back below +100
Sell signal when the CCI passes under -100, followed by a buy signal once it climbs back above -100
Since the -100/+100 zone is considered to be a zone where no clear trend can be detected, no position will be taken between these limits.

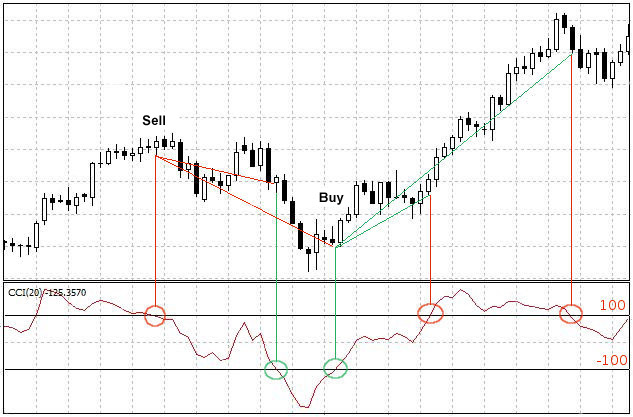
Generating buy or sell signals in a market with no apparent trend
Buy signal when the indicator exits the -100 oversold level. The position can then be closed once the indicator gets within the +100 overbought zone or once it has fallen back under +100.
Sell signal when the CCI exits the +100 overbought level. The position can then be closed once the indicator gets within the -100 oversold zone or once it has climbed back above -100.
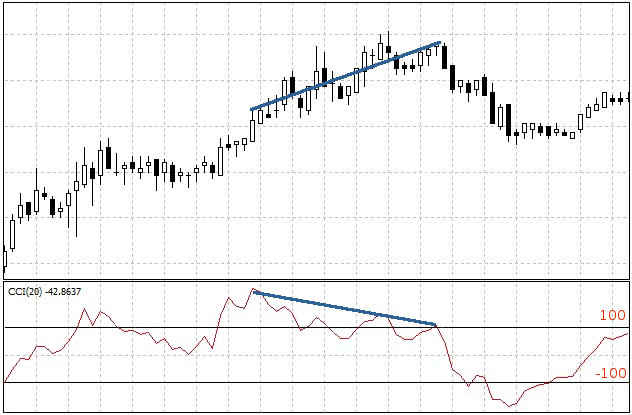
Looking for gaps
A gap appears when the prices and the indicator do not evolve in the same direction. This gap means that the trend is weakening, and it is typically followed by a price correction.