Trading with Bill Williams' fractal indicator technique

Although prices may seem random, they actually manifest themselves via repetitive patterns. One of the most basic repetition patterns is a fractal. Fractals are simple 5-bar inversion models - they were invented by Bill Williams.
Bill Williams was a well-known trader, author, and instructor with over 50 years of trading experience across multiple markets. He was known for his views on the psychology of trading, chaos theory and its application to technical analysis. He saw the market as having 5 dimensions that help traders understand the market's structure, and he developed several popular indicators. (Fractals, the Alligator, the Market Facilitation Index, the Awesome Oscillator and the Gator Oscillator).
Fractals are very useful for technical analysis and trading:
- They offer an entry strategy.
- They also provide stop loss levels.
- Fractals are natural support and resistance levels.
- Over longer periods of time, fractals can indicate significant levels.
- Fractals can be useful to identify Fibonacci retracement levels.
- Fractals make it possible to identify a trend (without bias).
Introduction to trading with fractals
When people hear the word "fractals", they often think of complex mathematics. This is not what we're talking about here. Fractals also refer to a recurrent trend that occurs in the midst of larger and more chaotic price movements.
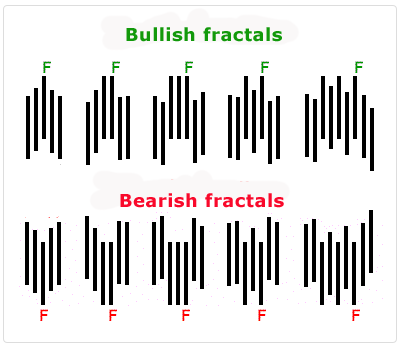
A fractal is an entry technique that is traditionally defined as "a bar that has two previous bars and two following bars with lower highs or lower lows".
The below examples illustrate the various types of 5-bar fractals:

The obvious disadvantage here is that fractals lag behind indicators because they are drawn with a 2-bar delay. However, most significant trend reversals continue with other bars. Once a trend has been identified, the price should increase after a bullish fractal, or drop after a downward fractal.
Fractals indicate breakpoints
As fractals highlight the points where the trend has not held up and has been reversed, a new force can occur when the price crosses the previous fractal. The trading of break points is therefore an obvious and simple application of the Fractal indicator.
Using fractals as the linking points of trend lines
Fractals can offer an advantage to forex traders since other traders also use the same obvious prices to draw their trend lines. The Fractal indicator makes it easy to identify and connect the most significant high and low points in order to draw trend lines.
Using fractals to confirm of a trend
As a trend (upwards or downwards) progresses, new fractals appear. If the break through a previous fractal fails, this is a first sign of price consolidation.
Trading using fractals: Bill Williams' chaos theory
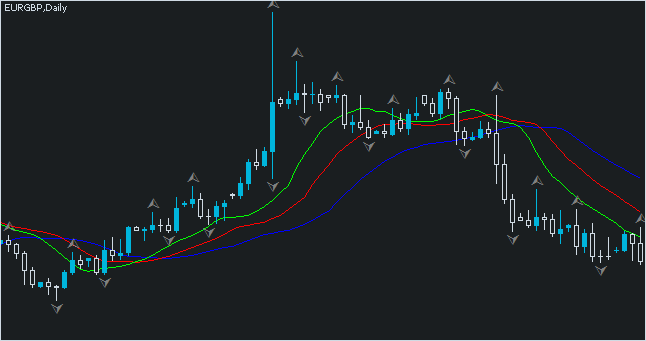
The fractal indicator is one of the five indicators used in Bill Williams' trading system. According to his trading strategy, fractals must be filtered using a confirmation indicator. The alligator is the one that is used most often. This indicator is created from 3 moving averages.

- If a "buy" fractal is above the alligator's teeth (red line), traders must place a buy order a few points above the "buy" fractal.
- If a "sell" fractal is below the alligator's teeth, traders must place a sell order a few points below the "sell" fractal's lowest point.
- Don't open any buy positions if a fractal forms below the alligator's teeth.
- Don't open any sell positions if a fractal forms above the alligator's teeth.
The main rule that takes priority over all rules when using Bill Williams' system: don't follow the signals of any other indicators until the first fractal (buy or sell) has formed outside of the alligator's teeth.
Fractals and Fibonacci retracement levels
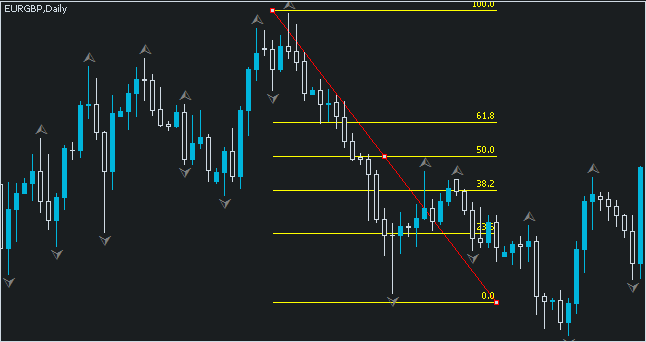
Another strategy is to use fractals with Fibonacci retracement levels. One of the problems with fractals is finding the one to use to initiate a trading position. And one of the problems with Fibonacci retracement levels is choosing the retracement level to use. By combining the two, the possibilities are reduced, since a Fibonacci level will be traded only if a reversal fractal occurs from that level.

Test this trading strategy on a demo account
All of the technical indicators presented here in this article are available for free on the MT4, MT5 and cTrader trading platforms.
 |  |  |
CFD trading is speculative and involves a significant risk of loss, so it is not suitable for all investors (74-89% of retail investor accounts lose money when trading CFDs).