Analysis of financial market cycles
A cycle is an event, such as a maximum or a minimum price, that is repeated on a regular basis. Cycles exist in the economy, in nature and in the financial markets. The basic economic cycle includes an economic recession, a slowdown, an economic recovery and a rise. Cycles are also part of our technical analysis of financial markets. The theory of market cycles asserts that cyclical forces, both in terms of buying and selling, determine the movement of prices on the financial markets.
Price and time cycles are used to anticipate market tipping points. Typically, bottoms are used to define the cycle time and then project the future bottom of the cycle. Although there is evidence that cycles exist, they tend to change over time and can even disappear for a while. Although it may sound daunting, trends actually work the same way. In fact, it is obvious that the markets have trends, but these tend not to show up all the time. A trend disappears when markets enter a trading range and reverse when prices change direction. Cycles can also disappear and even reverse. Don't expect cycle analysis to clearly indicate the ups and downs of the stock markets. Cycle analysis should instead be used in conjunction with other technical analysis aspects to anticipate tipping points.
The ideal cycle
The below illustration shows a perfect 100-day cycle. The first peak is at 25 days and the second peak is at 125 days (125 - 25 = 100). The minimum of the first cycle is at 75 days and the minimum of the second cycle is at 175 days (also 100 days later). Note that the cycle crosses the X axis at 50, 100, and 150, which means that there's half a cycle every 50 days.
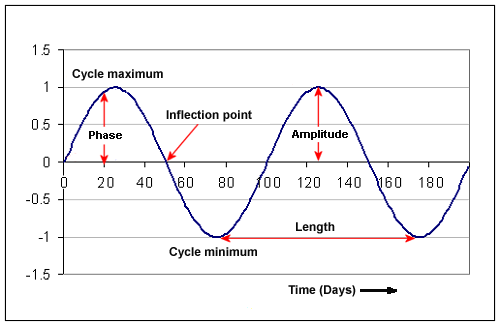
- Peak: cycle maximum.
- Bottom: cycle minimum.
- Phase: position of the cycle at a given time (the cycle example is set at 0.95 on day 20).
- Inflection point: this is where the cycle line crosses the x axis.
- Amplitude: height of the X axis cycle at the peak or bottom.
- Length: distance between cycle maximums or minimums.
Note that this is simply the description of the ideal cycle. Most cycles are not as well defined.
Features of market cycles
Cycle duration: minimums are typically used to define the duration of a cycle and to project the cycle into the future. We can expect a cycle maximum somewhere between the cycle minimums.
Discrepancies: cycles almost never reach their peak point at the exact midpoint or their low point at the expected minimum point of a cycle. Most often, peaks occur before or after the middle of the cycle. A peak towards the right is the tendency of prices to peak in the latter part of the cycle during bull markets. Conversely, a peak towards the left is the tendency of prices to peak in the first half of the cycle during periods of declining markets. Prices tend to rise later in bull markets and earlier in bear markets.
Harmonics: larger cycles can be divided into smaller and equal cycles. A 40-week cycle is divided into two 20-week cycles. A 20-week cycle is divided into two 10-week cycles. Sometimes a larger cycle can be divided into three or more parts. The reverse is also true. Smaller cycles can be multiplied into larger cycles. A 10-week cycle can be part of a larger 20-week cycle and an even longer 40-week cycle.
Nesting: a minimum cycle is reinforced when several cycles point to a bottom or a tunnel at the same time. 10-week, 20-week and 40-week cycles nest into each other when they all form a bottom at the same time.
Inversion: sometimes a maximum cycle occurs when there should be a cycle minimum and vice versa. This can happen when a high or low cycle is omitted or minimal. A low cycle can be short or almost nonexistent in a strong uptrend. Likewise, markets can fall quickly and skip a high cycle in the event of heavy declines. Inversions are greater with shorter cycles and less frequent with longer cycles. For example, we would expect more investments with a 10-week cycle than with a 40-week cycle.
Market data categories
The data points of a price chart can be divided into 3 categories: trend data, cyclical data and random data. Trend data points are part of a sustained directional movement, usually upwards or downwards. Cyclical data points are recurring deviations from the average. Deviations occur when prices are above or below the average. Random data points are market noise, usually caused by intraday or daily volatility.
Cycles can be found by removing trends and random noise from price data. Random data points can be eliminated by smoothing the data with a moving average. Trends can be isolated by eliminating trends from the data. This can be done by focusing on price movements above and below a moving average. You can also use the Detrended price oscillator indicator (see below).
Steps to identify market cycles
Examine price charts
When looking for cycles, it's better to view price changes as a percentage rather than in absolute terms. On an arithmetic scale, a rise from 100 to 200 will be the same as a rise of 300 to 400, or +100 points, but very different in terms of percentage. A change from 100 to 200 is +100%, while a change from 300 to 400 is +33.3%.
On a logarithmic scale, the move from 100 to 200 will appear much larger than that from 300 to 400, because the percentage of variation from 100 to 200 is three times higher. A logarithmic scale chart is necessary to correctly compare price movements over a long period of time with larger price changes.


Smoothing of prices with a basic short moving average (low period)
The idea here is to eliminate random market noise and focus on general movements. A short 5-day moving average is often sufficient. Smoothing also helps define reaction minimums when volatility is high, as shown in the below chart:

Visually analysing charts to identify possible highs and lows
This might be the easiest way to identify market cycles. Find low points that appear to have the same cycle length and extend this cycle into the future.
Eliminate price trends in order to focus on the minimum/maximum cycle
The elimination of trends in a series of price data can be done using the Detrended Price Oscillator (DPO). This indicator is based on a centered moving average, i.e. a moving average shifted to the left by a (N/2 + 1) factor.
A 20-day DPO is based on a 20-day moving average shifted to the left (past) by 11 days [(20/2 + 1) = 11]]. The DPO is therefore the closing price minus the moving average value. The resulting oscillator reflects price movements above and below this moving average. You can also use the oscillator's oscillations to identify a cycle. We can see that the DPO ends before the last price. This is because the moving average is moving and the DPO is aligned with the moving average. This often allows the DPO to be adjusted according to the cycle's duration. Use a 10-period DPO when looking for a minimum 10-day cycle or a 40-day DPO when looking for a minimum 40-day cycle.
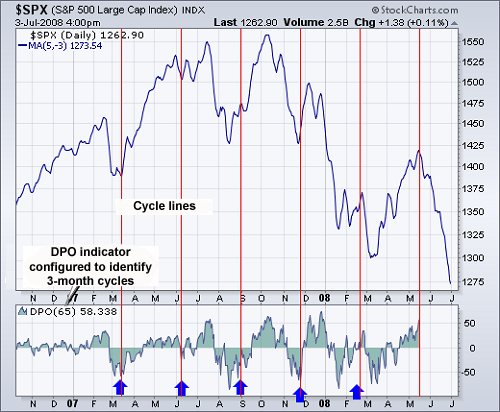
The following image shows a chart of the S&P 500 (SPX) with the DPO oscillator and cycle lines. The chart is displayed on a logarithmic scale to visualise the percentage movements. SPX is represented by a simple 5-day moving average that moves over 3 days. This places the chart in the middle of the moving average period. Visual analysis suggests that there is a three-month development cycle. As a result, the DPO is set at 65 days to confirm the cycle. The DPO becomes negative every few months to confirm that a recurring cycle is occurring. The blue arrows indicate the initial estimates for the 65-day cycle. The "Cycle lines" tool allows you to dispatch the cycles and uniformly project them into the future (tool available on the MetaTrader 4 and MetaTrader 5 platforms).
The presidential cycle
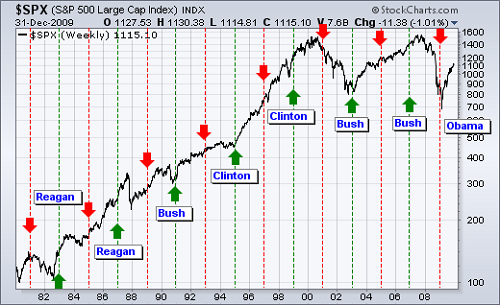
As its name suggests, the presidential cycle is based on the first and second half of the American presidential term. This cycle is not foolproof, but it has worked well for the past 50 years. In general, stocks tends to rise, but the S&P 500 index increases more in the second half of a president's term than in the first half. The below chart shows the S&P 500 with the presidential cycles of the past 20 years. It begins with the first two years of Reagan (1981-1982) and ends with the first year of Obama (2009).
Yale Hirsch, founder of Stock Trader's Almanac, discovered the 6-month cycle in 1986. This cycle is one of the most popular on Wall Street. The bullish period is from November to April and the bearish period is from May to October. Sy Harding took the 6-month cycle and the presidential cycle and added an MACD indicator to determine when to enter the market. Basically, buy when the 2 cycles are bullish and the MACD becomes positive. Sell ??when the 2 cycles are bearish and the MACD becomes negative. This is a great example of the use of other indicators and cycles.
Conclusions
Once identified and understood, financial market cycles can add significant value to your technical analysis toolbox. However, they are not perfect. Some will fail, others will disappear and still others will offer good opportunities. This is why it is important to use cycles in conjunction with other technical analysis tools. The trend determines the direction, oscillators define the dynamics and the cycles anticipate turning points.
Look for confirmation via support and resistance lines in a price chart, or a reversal in a pulse oscillator. Combining cycles can also be helpful. For example, the stock market is known to have 10-week, 20-week and 40-week cycles. These cycles can be combined with the 6-month cycle and the presidential cycle for added value. Trading signals become more reliable when several cycles are nested in a minimum or a maximum cycle.