Camarilla pivot points
Camarilla pivot points were invented by trader Nick Stott in 2000. This formula helps determine price levels that are similar to pivot points, although many traders claim they are more effective. This strategy assumes that the market tends to return to a certain point of equilibrium that one might call the average, the pivot, etc. Based on this idea and using the Camarillia equation, it is possible to calculate 8 price points where trend changes are likely to occur.
The equations for the calculation of the 8 levels are as follows:
- R4 = ((H-L)*(1.1/2)) + C
- R3 = ((H-L)*(1.1/4)) + C
- R2 = ((H-L)*(1.1/6)) + C
- R1 = ((H-L)*(1.1/12)) + C
- S1 = C - ((H-L)*(1.1/12))
- S2 = C - ((H-L)*(1.1/6))
- S3 = C - ((H-L)*(1.1/4))
- S4 = C - ((H-L)*(1.1/2))
where:
- H = Highest price of the previous session.
- L = Lowest price of the previous session.
- C = Closing price of the previous session.
As in the case of pivot points, there are currently several variations of these formulas, the best known being the one that adds the following 2 levels:
- R5 = (H/L) * C
- S5 = C - (R5-C)
The following image shows, at a general level, how to proceed using only the most important levels calculated with the Camarilla equation:
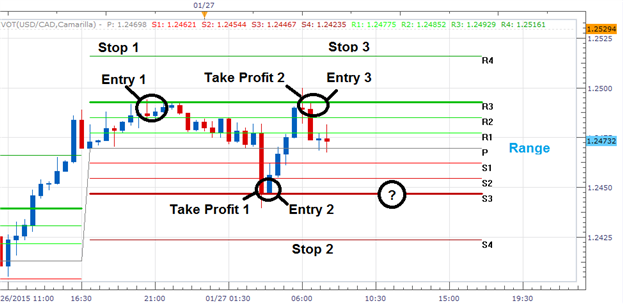
How do Camarilla pivot points work?
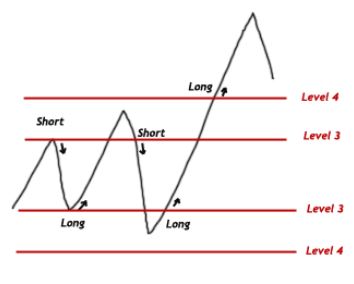
When we use the levels calculated using the above equation, S1, S2, S3, and S4 are the support levels, while R1, R2, R3 and R4 are the resistance levels. Also, the S3, S4, R3 and R4 levels are considered to be the most relevant. Therefore, when price reaches the R3 level, it is facing very strong resistance and so the trader should consider opening a sell position and closing any buy position that he may have. If he opens the sell position, he must place a stop loss at R4. Likewise, if the price falls to S3, the trader should open a buy position and place a stop loss at S4.
When the price breaks through the R4 and S4 levels, it is recommended that you go in the same direction as the breakout, which means you should buy if it breaks through R4 and you should sell if it breaks through S4. However, it is important to wait for the price to stay above R4 or below S4 for at least two or more candlesticks.
Of course, this technique must not be applied 100% of the time - you can employ alternatives to this system which will largely depend on the market you are trading. Ultimately, it is best for you to assess this trading strategy on a demo account to avoid unnecessary losses.
Download the Camarilla pivot point indicator
 |  |  |